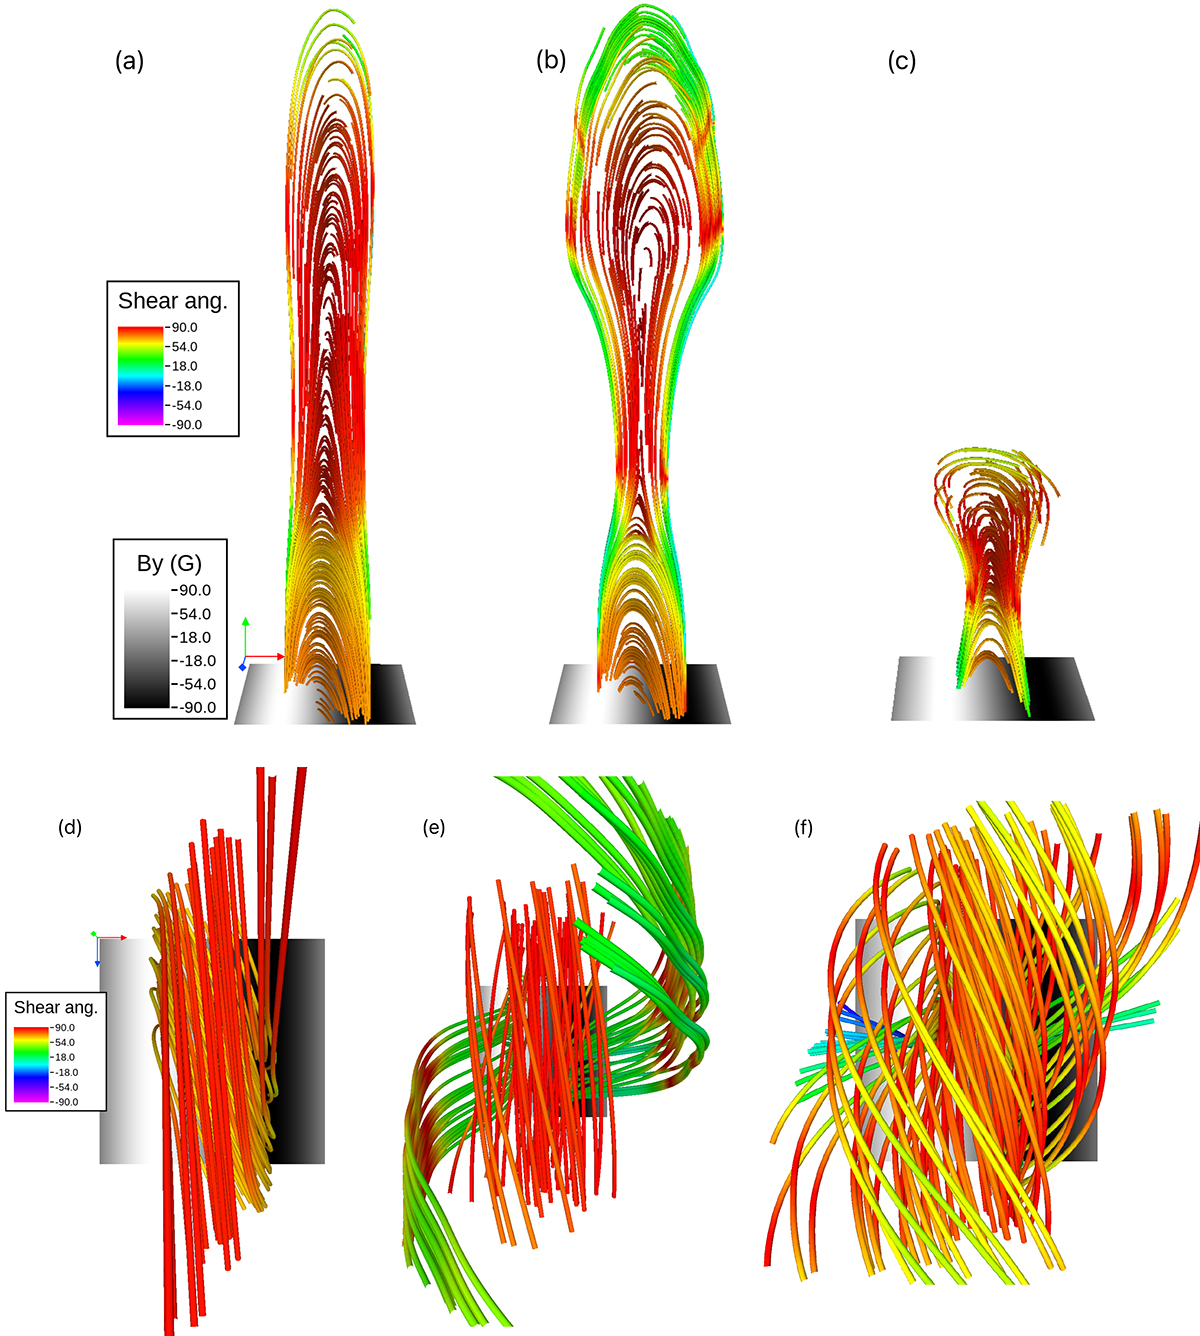
Fig. 2.
Download original image
Variation of the shear angle along the magnetic field lines from the central arcade region for t = 5.44, 7.51, and 12.59 min (from left to right columns) obtained from simulation 1. The different shear angles (in degrees) are shown in different colors. The top and bottom rows represent the side and top views of the field line configurations. The 2D slices show the spatial variation of By in the x − z plane at the base of the simulation box, and values of By are shown by the color bar common for all the panels. The orientation of the x, y, z axes are shown in red, green, and blue arrows, respectively. For better visualization of the field lines, fewer field lines are shown in the bottom panels compared to the corresponding top panels.
Current usage metrics show cumulative count of Article Views (full-text article views including HTML views, PDF and ePub downloads, according to the available data) and Abstracts Views on Vision4Press platform.
Data correspond to usage on the plateform after 2015. The current usage metrics is available 48-96 hours after online publication and is updated daily on week days.
Initial download of the metrics may take a while.