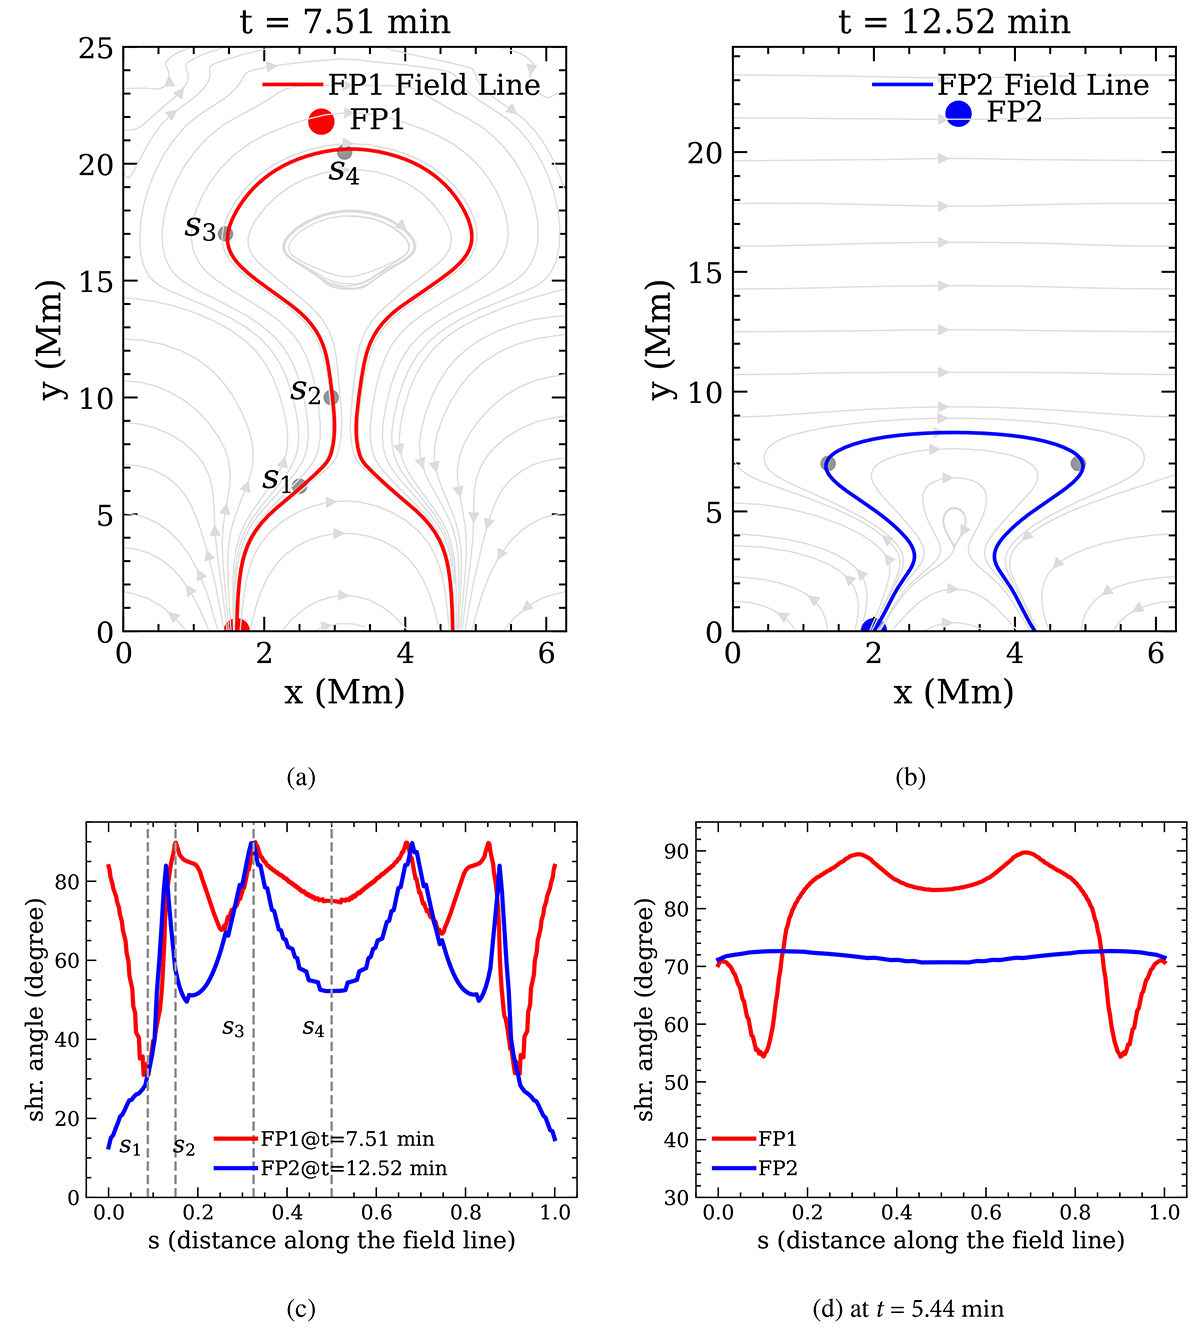
Fig. 3.
Download original image
(a) Distribution of magnetic field lines (in gray) for the entire spatial domain of simulation 1 at t = 7.51 min. The red curve represents the field line that is anchored at the seed point (footpoint) location (x, y) = (1.61, 0) Mm (FP1), marked by the red circle. (b) Same as the top-left panel but for t = 12.52 min. The blue field line is anchored at the seed point location (x, y) = (2, 0) Mm (FP2). (c) The red and the blue curves represent the distribution of the shear, γ, along the red and blue field lines as shown in the top-left and top-right panels, respectively. The vertical dashed lines are the positions along the red field line marked by the gray dots (s1, ..,s4) at the top-left panel. (d) Distribution of γ along the field lines anchored at FP1 (red curve) and FP2 (blue curve) at the beginning of the semi-equilibrium phase at t = 5.44 min.
Current usage metrics show cumulative count of Article Views (full-text article views including HTML views, PDF and ePub downloads, according to the available data) and Abstracts Views on Vision4Press platform.
Data correspond to usage on the plateform after 2015. The current usage metrics is available 48-96 hours after online publication and is updated daily on week days.
Initial download of the metrics may take a while.