Fig. 4.
Download original image
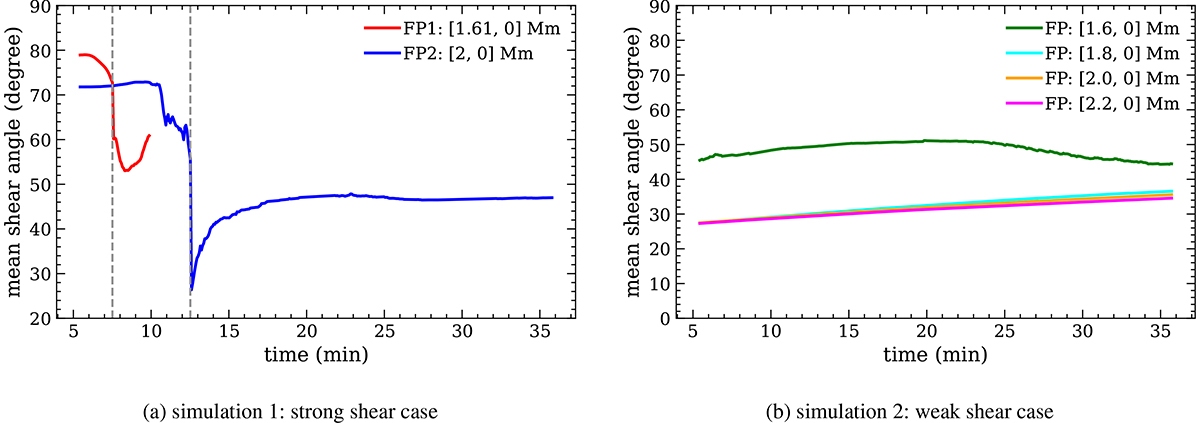
(a) Temporal variation of the mean shear (![]() ) of the field lines anchored at FP1 (red curve) and FP2 (blue curve) for the simulation with strong initial shear (simulation 1), which has multiple flux rope eruptions. The vertical dashed lines are the time markers at t = 7.51 and 12.52 min, after which the reconnection occurs at those field lines. (b) Temporal variation of
) of the field lines anchored at FP1 (red curve) and FP2 (blue curve) for the simulation with strong initial shear (simulation 1), which has multiple flux rope eruptions. The vertical dashed lines are the time markers at t = 7.51 and 12.52 min, after which the reconnection occurs at those field lines. (b) Temporal variation of ![]() for the field lines anchored at different footpoints as shown in the legend for the simulation with a weak initial shear (simulation 2), which do not experience the formation of any flux rope.
for the field lines anchored at different footpoints as shown in the legend for the simulation with a weak initial shear (simulation 2), which do not experience the formation of any flux rope.
Current usage metrics show cumulative count of Article Views (full-text article views including HTML views, PDF and ePub downloads, according to the available data) and Abstracts Views on Vision4Press platform.
Data correspond to usage on the plateform after 2015. The current usage metrics is available 48-96 hours after online publication and is updated daily on week days.
Initial download of the metrics may take a while.