Open Access
Fig. 5.
Download original image
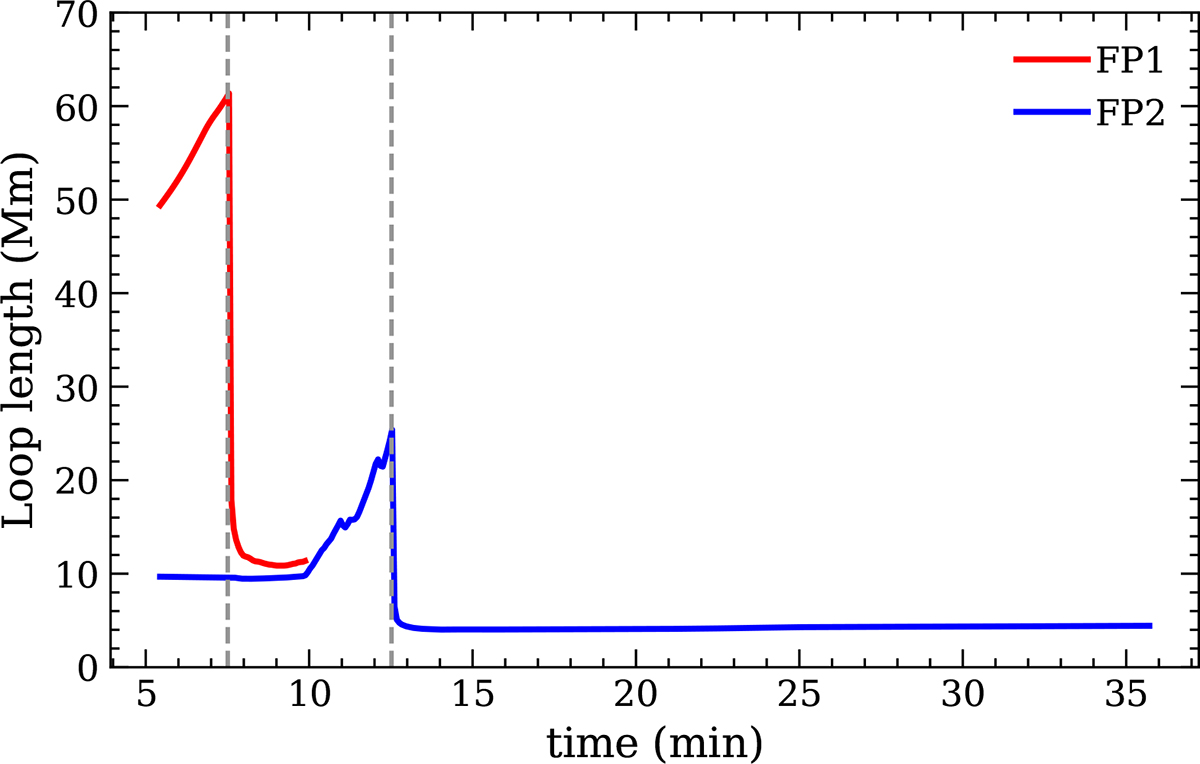
Temporal variation of the total arcade length anchored at FP1 (red curve) and FP2 (blue curve) for simulation 1. The left and right vertical dashed lines are the time markers for t = 7.51 and 12.52 min, respectively.
Current usage metrics show cumulative count of Article Views (full-text article views including HTML views, PDF and ePub downloads, according to the available data) and Abstracts Views on Vision4Press platform.
Data correspond to usage on the plateform after 2015. The current usage metrics is available 48-96 hours after online publication and is updated daily on week days.
Initial download of the metrics may take a while.