Open Access
Fig. 7.
Download original image
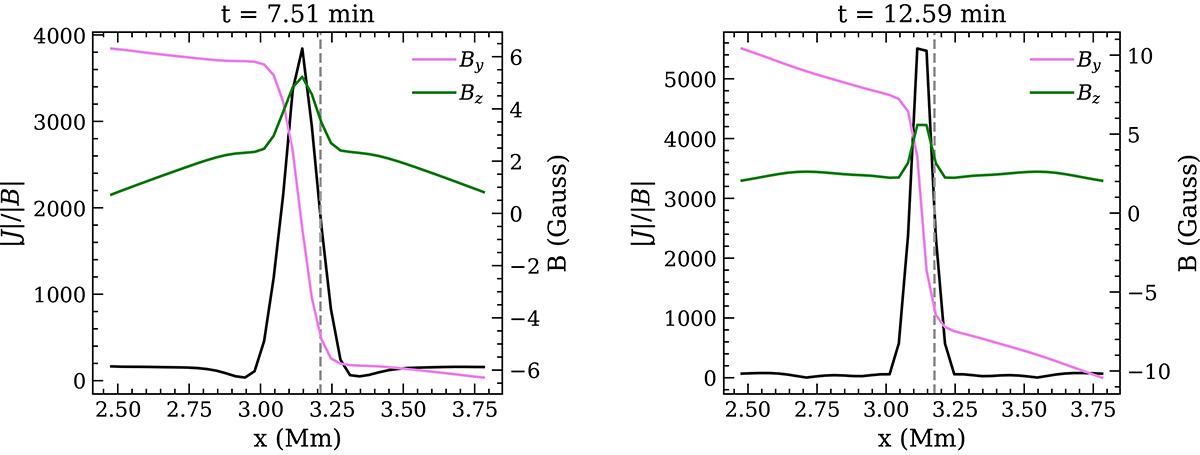
Spatial distribution of |J|/B| (black), vertical component (magenta), and guide field component (green) along the horizontal direction that passes through the CS at y = 10 Mm and y = 3 Mm for the first (t = 7.51 min; left figure) and second (t = 12.59 min; right figure) eruption phases, respectively.
Current usage metrics show cumulative count of Article Views (full-text article views including HTML views, PDF and ePub downloads, according to the available data) and Abstracts Views on Vision4Press platform.
Data correspond to usage on the plateform after 2015. The current usage metrics is available 48-96 hours after online publication and is updated daily on week days.
Initial download of the metrics may take a while.