Fig. 1
Download original image
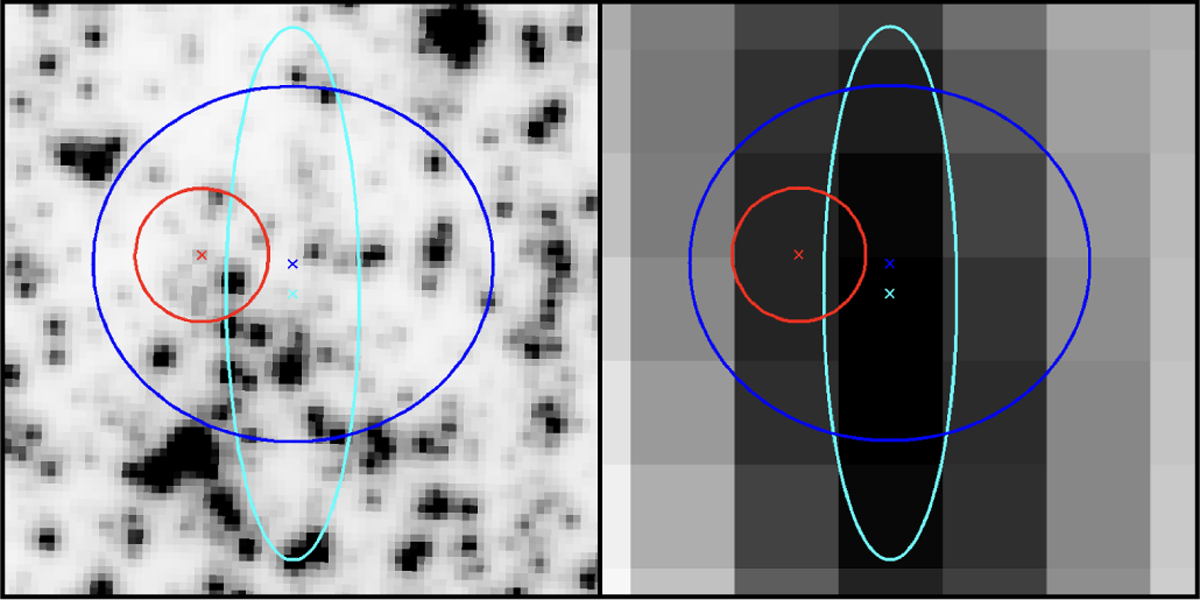
HST/ACS (left panel) and VLA (right panel; https://zenodo.org/records/12806382) images of the 4′′ × 4′′ region centered on the X-ray position of the RB quoted in Table 1. The crosses mark the coordinates listed in the table, and the ellipses have axes equal to three times the quoted uncertainties. Red, blue and cyan correspond to the values obtained for the candidate optical counterpart (this work), the X-ray, and the radio-band positions of the RB (Homer et al. 2001; van den Eijnden et al. 2024, respectively). North is up, and east is to the left.
Current usage metrics show cumulative count of Article Views (full-text article views including HTML views, PDF and ePub downloads, according to the available data) and Abstracts Views on Vision4Press platform.
Data correspond to usage on the plateform after 2015. The current usage metrics is available 48-96 hours after online publication and is updated daily on week days.
Initial download of the metrics may take a while.