| Issue |
A&A
Volume 703, November 2025
|
|
|---|---|---|
| Article Number | A182 | |
| Number of page(s) | 7 | |
| Section | Galactic structure, stellar clusters and populations | |
| DOI | https://doi.org/10.1051/0004-6361/202556238 | |
| Published online | 13 November 2025 | |
Potential discovery of the long-sought optical counterpart to the Rapid Burster in the bulge fossil fragment Liller 1★
1
Dipartimento di Fisica e Astronomia “Augusto Righi”, Alma Mater Studiorum Università di Bologna,
via Piero Gobetti 93/2,
40129
Bologna,
Italy
2
INAF-Osservatorio di Astrofisica e Scienze dello Spazio di Bologna,
Via Piero Gobetti 93/3
40129
Bologna,
Italy
3
Department of Physics, University of Alberta,
Edmonton, AB T6G 2G7,
Canada
4
Center for Astrophysics | Harvard & Smithsonian,
60 Garden Street,
Cambridge,
MA 02138,
USA
5
Eureka Scientific, Inc.,
2452 Delmer Street,
Oakland,
CA 94602,
USA
6
Institute for Astronomy, University of Edinburgh, Royal Observatory, Blackford Hill,
Edinburgh EH9 3HJ,
UK
7
IRAP, CNRS,
9 avenue du Colonel Roche, BP 44346,
31028
Toulouse Cedex 4,
France
8
Université de Toulouse, CNES,
UPS-OMP,
31028
Toulouse,
France
★★ Corresponding author: This email address is being protected from spambots. You need JavaScript enabled to view it.
Received:
3
July
2025
Accepted:
7
September
2025
Abstract
We report the possible identification of the optical counterpart of the Rapid Burster MXB 1730-335 in the stellar system Liller 1. The identification was performed by taking advantage of a set of images acquired with the Hubble Space Telescope/Advanced Camera for Surveys in the optical band, and with the Gemini South Telescope in the near-infrared. The analysis of these images revealed a star with a position that might be compatible with the X-ray and radio-band coordinates of the Rapid Burster, and it varies significantly in the optical. According to its location in the color-magnitude diagram, the candidate companion appears to belong to the young (∼ 1−2 Gyr old) supersolar metallicity ([M/H]=+0.3) subpopulation recently discovered in Liller 1. We discuss the main characteristics of the candidate counterpart and the Rapid Burster binary system as derived from the available data. We also highlight the need for further coordinated observations to solidly confirm their association and better clarify their physical properties.
Key words: techniques: photometric / X-rays: bursts / globular clusters: individual: Liller 1
Based on observations with the NASA/ESA HST, obtained under program GO 15231 (PI: Ferraro). The Space Telescope Science Institute is operated by AURA, Inc., under NASA contract NAS5-26555.
© The Authors 2025
 Open Access article, published by EDP Sciences, under the terms of the Creative Commons Attribution License (https://creativecommons.org/licenses/by/4.0), which permits unrestricted use, distribution, and reproduction in any medium, provided the original work is properly cited.
This article is published in open access under the Subscribe to Open model. This email address is being protected from spambots. You need JavaScript enabled to view it. to support open access publication.
1 Introduction
The Rapid Burster (MXB 1730-335; hereafter RB) was discovered about 50 years ago by Lewin et al. (1976) and was soon after associated with Liller 1 (Liller 1977), a massive (∼ 106 M⊙; Saracino et al. 2015) and highly obscured (Valenti et al. 2010; Pallanca et al. 2021) stellar system in the Galactic bulge (see below for details). The RB is an accreting binary system hosting a neutron star (NS), and it is expected to share most of the characteristics of low-mass X-ray binaries (LMXBs). Its properties are very surprising, however, because it shows a unique behavior in terms of X-ray emission (see Lewin et al. 1995 for a review). It is the only known source undergoing both type I and type II X-ray bursts (Hoffman et al. 1978), and it is also one of only two sources known so far showing type II X-ray bursts (the other source is the so-called bursting pulsar GRO J1744-28; Fishman 1995; Kouveliotou et al. 1996).
Briefly, type I bursts are characterized by a spectral softening during the burst decay, suggesting a decrease in the effective temperature and thus a cooling of the NS atmosphere. They are thought to be due to thermonuclear flashes of material accreted onto the NS surface (Galloway & Keek 2021). These characteristics are typical of many LMXBs hosting NSs with a low magnetic field (Masetti 2002; see also Galloway et al. 2008; Bagnoli et al. 2013; in’t Zand et al. 2017). Type II bursts, with very short recurrence times (∼ 7 s to ∼ 1 h; Sala et al. 2012), have been suggested not to be powered by thermonuclear burning, but rather to result primarily from the release of gravitational energy from the inner accretion disk during spasmodic accretion events (Guerriero et al. 1999; Hoffman et al. 1978; Marshall & Lewin 1978; Spruit & Taam 1993; D’Angelo & Spruit 2010).
Since its discovery, the RB appeared to be a recurrent transient with outbursts lasting a few weeks, followed by quiescent or off-state intervals, which generally last ∼ 6−8 months (Lewin et al. 1993; Guerriero et al. 1999). This behavior might be caused by some storage mechanism of accretion energy in the disk around the accreting NS, as described in the disk-instability model (see, e.g., Lasota 2001). At the end of 1999 (MJD ∼ 51 500), a sudden change in the outburst recurrence time and in the X-ray peak intensity was detected (Masetti 2002): The time between consecutive bursts decreased from ∼ 210 days to ∼ 100 days, and the X-ray peak emission decreased by a factor ∼ 2. This behavior might be connected with an increase in the quiescent mass-transfer rate from the secondary (Masetti 2002).
Because of its uniqueness, several multiwavelength studies of the RB have been performed. For instance, the radio counterpart was identified by Moore et al. (2000) and was recently studied by van den Eijnden et al. (2024), who found evidence that the radio emission is produced by a jet. Fox et al. (2001) searched for type I burst oscillations, finding a modulation near 307 Hz that is indicative, if confirmed, of a spin period of 3.25 or 6.5 milliseconds, depending on whether the main burst signal is the fundamental or first harmonic of the spin frequency.
Kulkarni et al. (1979) reported the detection of six infrared (IR) bursts of about 30 s each during 2.5 hours of observations. According to the authors, the similarities (rise time, duration, and gradual decay in intensity) of these IR bursts with the type I X-ray bursts detected by Lewin et al. (1976) and Hoffman et al. (1978) suggested an association between the X-ray and the IR sources. They also proposed that the detected IR emission was unlikely to be blackbody radiation, suggesting that the donor star was still hidden in the highly obscured and crowded population of Liller 1. Kawara et al. (1984) reported the absence of IR bursts during a type I X-ray burst, however, and ruled out the connection between type I X-ray bursts and the IR bursts detected by Kulkarni et al. (1979).
Homer et al. (2001) also searched for the IR counterpart to the RB using archival ESO/NTT1 and HST/NICMOS2 images, confirming that none of the detected stars in the adopted error circle show the properties commonly found for Roche lobe-filling donor companions, such as unusual IR colors and/or photometric variability (e.g., Pallanca et al. 2010; Ferraro et al. 2001). A few other works were aimed at constraining the physical properties of the NS and/or the binary systems. For example, Sala et al. (2012) presented a detailed study of one of the type I bursts, with the goal to constrain the NS mass and radius: Assuming a distance between 5.8 and 10 kpc, they derived a mass M=1.1 ± 0.3 M⊙ and a radius R=9.6 ± 1.5 km. The investigation of Simon (2006), based on the comparison of the flux decay to the King & Ritter (1998) model, suggested an orbital period in the range 3.5−5.5 hours.
In addition to the unique properties of the RB, recent findings have unveiled the peculiar nature of the host stellar system (Ferraro et al. 2021, 2025). In spite of the initial classification as a globular cluster (GC), recent photometric and spectroscopic studies have demonstrated that Liller 1 is instead a complex stellar system, with a star formation history characterized by multiple bursts of star formation (Ferraro et al. 2021; Dalessandro et al. 2022; Origlia et al. 2002; Crociati et al. 2023; Alvarez Garay et al. 2024; Fanelli et al. 2024). At least two main subpopulations have been found to coexist in this stellar system: a 12 Gyr-old population at subsolar metallicity ([Fe/H] ∼−0.4), and a supersolar (with [Fe/H]=+0.3) much younger component of just 1−2 Gyr, which is also more centrally segregated (Ferraro et al. 2021; Pallanca et al. 2021). The striking chemical similarity between Liller 1 and the bulge field proves a deep connection between the two structures (Ferraro et al. 2025) and suggests that (similarly to Terzan 5; Ferraro et al. 2009, 2016; Origlia et al. 2013, 2025) Liller 1 might be a bulge fossil fragment, namely the remnant of one of the building blocks that contributed to the formation of our spheroid at the epoch of the Milky Way assembly. This new emerging scenario further enhances the uniqueness of the RB, which is found to be peculiar not only in its own properties, but also with respect to its hosting environment.
We report the possible identification of the optical counterpart to the RB obtained from the analysis of a set of optical and near-IR high-resolution images secured in the core of Liller 1. The datasets and catalogs we used are reported in Section 2, and Section 3 presents the properties of the star proposed as the RB counterpart. Finally, Section 4 summarizes the key findings.
Most recent X-ray and radio-band positions of the RB, and coordinates of its candidate optical counterpart.
2 Observations and data analysis
Table 1 reports the absolute coordinates of the RB as obtained from the most recent X-ray and radio-band observations. They agree on localizing the RB in the most crowded region of Liller 1, at only 2.8′′ from its gravitational center (Saracino et al. 2015). This implies that images with a high angular resolution are mandatory to properly resolve individual stars and search for the optical counterpart to the RB, and we therefore took advantage of the multiwavelength (optical and IR) dataset presented by Pallanca et al. (2021) and already used by Ferraro et al. (2021) and Dalessandro et al. (2022). The optical dataset was acquired with the HST/ACS-WFC3 under program GO 15231 (PI: F.R. Ferraro), and it consists of six images of about 1330 s each in the F606W filter and six images of 800 s in the F814W filter. The IR dataset consists of 6 × 30 s images in the Ks filter acquired with the Gemini South Adaptive Optics Imager (GSAOI) assisted by the Gemini Multi-Conjugate Adaptive Optics System (GeMS), mounted at the Gemini South Telescope (Program ID: GS-2013-Q-23; PI: D. Geisler).
Because of high crowding, the photometric analysis had to be performed with the point spread function (PSF) fitting method, for which we adopted a synergistic approach aimed at extracting the most information from different wavelengths. In the following, we briefly summarize the main steps of the photometric analysis (see Pallanca et al. 2021, for more details). First of all, we modeled the PSF on a sample of isolated bright stars in each secured frame. The obtained PSF model was then applied to the master list of stellar objects identified in the images. The latter was built by compiling all the sources detected in at least one of the two datasets (i.e., optical and IR), with the aim to enhance the completeness of different spectral types.
The instrumental magnitudes were calibrated to the Vega-Mag system and corrected for differential reddening as described by Pallanca et al. (2021). To improve the astrometric precision of the photometric catalog, we also aligned the original astrometry (which referred to Gaia DR2; Gaia Collaboration 2018) to the most recent release, Gaia DR3 (Gaia Collaboration 2023). Individual magnitudes were finally homogenized to the first reference image of each frame by using the DAOPHOT routine DAOMASTER (Stetson 1987, 1994). In addition to the original photometry, we also computed the magnitudes and the corresponding MJD of single frames, with the aim to perform a detailed variability analysis of any promising candidate counterpart to the RB.
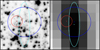 |
Fig. 1 HST/ACS (left panel) and VLA (right panel; https://zenodo.org/records/12806382) images of the 4′′ × 4′′ region centered on the X-ray position of the RB quoted in Table 1. The crosses mark the coordinates listed in the table, and the ellipses have axes equal to three times the quoted uncertainties. Red, blue and cyan correspond to the values obtained for the candidate optical counterpart (this work), the X-ray, and the radio-band positions of the RB (Homer et al. 2001; van den Eijnden et al. 2024, respectively). North is up, and east is to the left. |
3 The candidate optical counterpart to the RB
The identification of optical counterparts to exotic objects (e.g., X-ray binaries, millisecond pulsars, and cataclysmic variables) in high-density environments is a complex task because a large number of stars is typically detected within the positional error box of the investigated source. Moreover, the radio, X-ray, and optical astrometry of the same source can be misaligned to some extent (0.1′′; see, e.g., Edmonds et al. 2001, 2003; Albrow et al. 2001; Huang et al. 2010). In addition to the reasonable positional coincidence (within the errors) of the optical position with the radio and/or X-ray positions, one of the best features for identifying the optical counterpart to exotic objects therefore is the detection of a luminosity modulation connected with the orbital motion and/or the rotation of the source (see Pallanca et al. 2010, 2017; Ferraro et al. 2001; Cadelano et al. 2015). Moreover, the optical counterparts to interacting and/or transient binaries typically are highly perturbed, bloated, distorted and/or irradiated objects, and their magnitudes arise from the blending of the two stellar components and/or with an accretion disk. For these reasons, they are also expected to appear in anomalous positions in the color-magnitude diagram (CMD) with respect to the canonical sequences traced by normal cluster stars (see the example in Pallanca et al. 2010, 2013; Ferraro et al. 2015; Rivera-Sandoval et al. 2015; Cadelano et al. 2017; Lugger et al. 2023; Ettorre et al. 2025).
The left panel of Figure 1 shows the 4′′ × 4′′ region of an F814W HST/ACS image centered on the X-ray position of the RB reported in Table 1. The blue and cyan ellipses have axes equal to three times the RA and Dec uncertainties quoted in the table. Several stars are detected within these error ellipses. To identify the optical counterpart to the NS, we therefore searched for evidence of photometric variability.
A visual inspection of these images already provided us with indications of variability for one source. This is shown in Figure 2, where the star marked with a white circle appears to be brighter in the right than in the left panels in the F814W optical HST/ACS images (upper panels) and in the Ks-band GEMINI exposures (bottom panels). The location of this variable source with respect to the X-ray and radio-band positions of the RB is marked by the red cross and circle in Figure 1. To assess the significance of its variability, we used the external error provided by DAOPHOT, which quantifies the magnitude scatter among different exposures. For variable objects, this parameter is expected to be larger than that of nonvariable stars of similar mean magnitude. Figure 3 shows the values of the magnitude scatter calculated for all the stars observed within 20′′ from the RB (gray dots) as a function of their mean magnitude in the F606W, F814W, and Ks bands. Clearly, the detected source (red star in the figure) is the only star located within 1.5′′ from the RB position (black circles) with a magnitude scatter that is significantly larger than that of the objects with a similar magnitude.
In Figure 4 we plot the magnitude differences measured in the three investigated filters as a function of time. The observations secured through the F606W, and the F814W filters show a decrease and an increase in the luminosity on a timescale compatible with the orbital period (3.5−5.5 h) proposed by Simon (2006).
The K-band magnitudes show substantial scatter on short timescales, which is not physically plausible for emission from the donor star (which is expected to dominate at these wavelengths). Although we lack sufficient information to clearly explain this behavior, we can speculate that it might be caused by a dominant nonthermal component (such as a jet; Kulkarni et al. 1979) or by thermal reprocessing by an accretion disk (van Paradijs & McClintock 1994), which is expected to manifest as strong flickering. In the latter case, the system would be in outburst and the observed optical/NIR flux would likely be dominated by the accretion disk, thus giving us little information on the donor. In addition, we note that if the donor has a significantly higher mass than the accretor (as the counterpart mass may suggest; see Section 4), mass transfer would be unstable. In any case, it must be acknowledged that the K-band variability is less distinctive than in other stars (see Figure 3), suggesting that the short-term K-band variations might not be real. Unfortunately, given the short time-sampling of the available dataset and the relatively long exposure times, no firm conclusions on the characteristics of the light curve can be reached. Future simultaneous optical/near-IR observations (Russell et al. 2006) are required to fully dissect this binary system, but there is no doubt that this star presents the typical signature of a perturbed object.
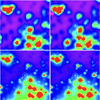 |
Fig. 2 Images of the 2′′ × 2′′ region surrounding the candidate optical counterpart to the RB (white circle) acquired at different times. The top and bottom panels show HST/ACS images in the F814W filter and Ks-band GeMS images, respectively. For visualization purposes, a 2-pixel smoothing has been applied to the F814W images. The images in the right panels were acquired approximately 1.5−2 hours after those in the left panels. The corresponding changes in magnitudes are about ∼ 0.4 mag for the Ks band (bottom row) and ∼ 0.5 mags for the F814W filter (top row). |
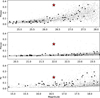 |
Fig. 3 Magnitude scatter measured for all the stars located within 20′′ (gray dots) from the RB X-ray position as a function of their magnitude. The black circles highlight all the sources detected within a distance of just 1.5′′ from the RB. The large red star marks the candidate optical counterpart. The top, middle, and bottom panels refer to the F606W, F814W, and Ks filters, respectively. |
4 Discussion and conclusions
The variable source detected in the HST and Gemini images is located at RA =17h 33m 24.66s, Dec =−33° 23′ 19.84′′ (J2000.0) in the ICRS Gaia DR3 astrometric system, with an uncertainty of 0.15′′ in both coordinates (see the red circle in Figure 1). Its declination is consistent with the values estimated in the X-ray and radio bands, while a larger offset is detected along the right ascension direction (see Table 1). The agreement with the Xray RA value is still within ∼ 1.5 σ. We also note that the X-ray coordinates quoted in Table 1 were shifted by 0.56′′ in RA and 0.08′′ in Dec with respect to the nominal Chandra coordinates (see the discussion in Section 2.2 of Homer et al. 2001), which indicates a possible additional source of uncertainty in the X-ray position. Instead, the right ascension values in the optical and radio bands are formally only consistent at 3 σ, and the VLA uncertainty quoted in Table 1 corresponds to 10% of the radio beam size when all baselines are used (see van den Eijnden et al. 2024). We note, however, that the coordinates provided in Section 2.1 of van den Eijnden et al. (2024) for a radio source used to check for the RB variability slightly differ from those quoted in their Table 2. Moreover, the emission shown in the observed radio map (see the right panel of Figure 1) appears to agree well with the position of the variable star detected in this study. Taking into account all the uncertainties, we therefore conclude that the position of the detected optical source is consistent within 1.5 σ in the worst case with the X-ray coordinates of the RB and within 3 σ in the worst case with its radio-band position.
This source alone of all the stars detected within a distance of ∼ 1.5′′ from the RB varies significantly photometrically (Figure 3). It shows light variations in all the investigated filters, with different properties at different wavelengths. In particular, in the optical band, it varies on a timescale of hours, which is compatible with the orbital period estimated by Simon (2006) as well as with higher values (up to one day), and it is consistent with typical orbital motion of compact binaries, suggesting heating and/or tidal distortions resulting in ellipsoidal variability (Kennedy et al. 2018; Pešta & Pejcha 2025). At larger wavelength (Ks band), the variability appears to occur on shorter timescales, and further investigation to verify the reality of the short-term variations is warranted. If they are real, they can help us understand its timescale and nature (due, e.g., to some jetrelated emission processes; Baglio et al. 2014). Based on the reasonable positional coincidence and the detected variability, we conclude that this star is a promising candidate for being the RB counterpart. Unfortunately, a firm and unambiguous association with the RB is prevented by the still unknown orbital period of the binary system and the incomplete sampling of the optical light curve. In this context, new observations that better characterize the light curve at different wavelengths simultaneously are crucial to determine the variability period and understand the accretion processes better that drive this unique system. The detection at the position of the candidate counterpart quoted here (see Table 1) of radio pulses with the spin frequency proposed by Fox et al. (2001) that are compatible with an orbital motion consistent with the magnitude modulations would be even more interesting.
To search for possible connections between the optical variability of the candidate counterpart and the X-ray variability of the RB, we compared the MJD of observations we discussed (see Figure 4) with the dates of the peak flux observed by MAXI4 reported by Heinke et al. (2025). Unfortunately, each of the three observations are in between the known outbursts seen with MAXI, at least one month apart from the nearest outburst peak. Even if the MAXI data do not strongly constrain the RB flux (largely because of absorption, and partly because of crowding; see Negoro et al. 2016 for all details about the MAXI data analysis), according to the MAXI datapoints acquired in the closest MJD epochs to the optical/IR observations, we roughly estimated upper limits on the corresponding X-ray fluxes. We found Lx<3 × 1036 erg s−1 (MJD ∼ 56 402), Lx<1037 erg s−1 (MJD ∼ 56 434), and Lx<5 × 1036 erg s−1 (MJD ∼ 58 712). Unfortunately, this brings no conclusive results and calls for future (almost) simultaneous X-ray and optical/IR observations, which are essential to investigate the association of the proposed counterpart with the RB and to gain a better understanding of the physics governing the evolution of this binary system.
Although the variability sampling is admittedly not optimal, we estimate that the candidate counterpart to the RB has mean magnitudes mF606W= 26.3, mF814W=22.0, and K = 16.6. Figure 5 shows its position (marked with a large red star) in the differential-reddening-corrected and proper-motion-selected CMD. It is fully compatible with the blue plume of Liller 1, corresponding to the main sequence of the very young and supersolar subcomponent recently discovered in this system (Ferraro et al. 2021). Its location along the main sequence of a 1 Gyr old isochrone (Bressan et al. 2012) with a global metallicity [M/H]=+0.3 (blue line in Figure 5) suggests a mass of ∼ 2 M⊙, a surface temperature of ∼ 7200 K, and a radius of 2.8 R⊙ for this star.
Assuming these parameters and using the orbital period/radius relation of Frank et al. (2002), we require a binary system with an orbital period of about 0.5−2 days. This is longer than the orbital period suggested by Simon (2006). We note, however, that at odds with the results discussed by Simon (2006), the overall outburst behavior of the RB (in’t Zand et al. 2003) is fairly similar to that of Aquila X-1 and GRS 1747-312, which have orbital periods of 19 hours (Chevalier & Ilovaisky 1991) and 12 hours (in’t Zand et al. 2003), respectively. This suggests that a longer period seems to be plausible.
On the other hand, the mass and radius derived above might not be fully reliable because the observed CMD position is altered by distortion/interaction effects with the accreting NS, or because there are additional components in the binary system (e.g., an accretion disk), in agreement with what observed in other interacting binaries (e.g., Ferraro et al. 2001; Edmonds et al. 2002; Bassa et al. 2004; Pallanca et al. 2010, 2013; Beccari et al. 2014; Ferraro et al. 2015; Kumawat et al. 2024). Curiously, the position of this star in the CMD is very similar to that of the X-ray burster EXO 1745-248 in Terzan 5 during the outburst phase (Ferraro et al. 2015). According to MAXI all-sky X-ray monitoring, however, the RB was either in quiescence or in the tail of an outburst in all the epochs sampled by the observations discussed in this paper. Hence, the observed optical emission is expected to largely come from the RB donor star (in place of accretion or jets). This would support the hypothesis that the donor star of the RB system is a metal-rich object that formed ∼ 1 Gyr ago during the most recent star formation burst that occurred in Liller 1 (Dalessandro et al. 2022). This might have important consequences for the characterization of the binary system and the accreting NS, and it might suggest that it also formed very recently and is not the remnant of a supernova explosion that occurred in the main epoch of star formation, ∼ 12 Gyr ago (see also the discussion by Patruno et al. 2012 for the case of IGR J17480-2446 in Terzan 5). Further modeling efforts may explore whether the physical properties of this young system are compatible with the unusual magnetic field characteristics of the RB, which was often associated with type II burst mechanisms.
The distance of Liller 1 is one of the key ingredients used by Sala et al. (2012) to constrain the physical properties of the NS that is hosted in the RB binary system from the observed photospheric radius expansion. These authors explored a range of distances between 5.8 and 10 kpc and obtained a mass M = 1.1 ± 0.3 M⊙ and a radius R = 9.6 ± 1.5 km. From the probability density distribution plotted in the NS mass-radius diagram (see their Figure 7), the most recent distance estimate (∼ 8.5 kpc; Ferraro et al. 2021) would favor the upper limits to the quoted mass and radius, consistently with recently derived physical properties of millisecond pulsars via X-ray pulse-profile modeling (e.g., Choudhury et al. 2024; Mauviard et al. 2025, for the two most recent measurements). It is important to emphasize, however, that other methods are commonly used to estimate the NS properties (e.g., Bhattacharyya 2010; Marino et al. 2018), and further studies are necessary for the RB case.
We emphasize that only a few X-ray sources (see Homer et al. 2001) and no millisecond pulsars have been detected in Liller 1 so far. This is somewhat peculiar because this stellar system is the only one so far that together with Terzan 5 (see Ferraro et al. 2016; Origlia et al. 2025) shows multi-iron (Ferraro et al. 2025) and multi-age stellar subpopulations (Ferraro et al. 2021), and it is considered a bulge fossil fragment. The chemical evolutionary model recently developed for Terzan 5 (Romano et al. 2023) combined with the reconstructed star formation histories of both systems (Crociati et al. 2024; Dalessandro et al. 2022) have demonstrated that their observed chemical patterns can be properly reproduced by assuming a high star formation rate and several 104 explosions of core-collapse supernovae, producing a large number of NSs. The high mass of the stellar system progenitor (estimated to be a few 107 M⊙; Romano et al. 2023) allowed the retention of this large population of remnants and the high collision rate (Verbunt & Hut 1987; Lanzoni et al. 2010), providing the ideal environment for the formation of binaries with (at least) one compact object. This scenario naturally explains the striking populations of X-ray sources (Heinke et al. 2006) and millisecond pulsars (Ransom et al. 2005; Corcoran et al. 2024) detected in Terzan 5, and in principle, a similar framework is also expected for Liller 1.
This apparent discrepancy might be due to several observing challenges, however. Liller 1 is moderately distant, quite extincted (Saracino et al. 2015; Pallanca et al. 2021) and, most importantly, it has a bright transient X-ray source that makes it difficult to study the other faint X-ray sources in the system. It is also worth mentioning that (Fruchter & Goss 2000) reported a steep-spectrum radio emission from Liller 1 that was not found by (McCarver et al. 2024), however, with observations acquired at higher angular resolution. This suggests that the observed emission may originate from several pulsars that still remain undetected because of strong scattering and a likely large (but still unconstrained) dispersion measure.
Understanding the physical phenomena characterizing the RB might be fundamental in the context of clarifying the properties and evolutionary paths of other exotica populating GCs, such as the fast radio burst (FRB) detected in an extragalactic GC by Zhang et al. (2024), a binary millisecond pulsar with a NS/black hole companion (Barr et al. 2024), or, more generally, binaries containing compact objects and their potential as GW emitters. For example, Kremer et al. (2023) suggested that FRBs in GCs might be generated from a newly born NS (formed through the accretion induced collapse scenario; see Tauris et al. 2013) that might still reside in a binary system. In this case, a fraction of GC FRB sources are expected to have binary companions, which produces interesting observational consequences, such as periodicity in burst repetition (e.g., Lyutikov et al. 2020), persistent X-ray emission (from possible subsequent accretion through Roche-lobe overflow; e.g., Tauris et al. 2013), or a timedependent dispersion measure and/or rotation measure. Hence, the investigation of a relative nearby binary system hosting a unique NS, such as the RB, may be helpful also for interpreting some peculiar properties of more elusive extragalactic sources.
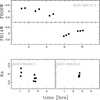 |
Fig. 4 Magnitude differences with respect to the mean value in the F606W, F814W, and Ks filters (top, middle, and bottom panels, respectively) as a function of time. The latter is calculated in hours with respect to the reference MJD marked in each panel. The error bars for the magnitudes are displayed and are comparable in size to the plotted symbols. |
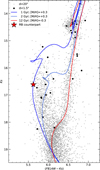 |
Fig. 5 Differential-reddening-corrected and proper-motion-selected CMD of all the stars detected within 20′′ from the RB X-ray position (gray dots). The black circles and the large red star highlight the sources located within a distance of 1.5′′ and the candidate optical counterpart to the RB, respectively. The red and blue lines (see also legend) are a 12 Gyr old isochrone (Bressan et al. 2012) with [M/H]=−0.3 (well reproducing the old subpopulation of Liller 1), and two 1–2 Gyr old isochrones with [M/H]=+0.3 (tracing the young and supersolar subpopulation), respectively. |
Acknowledgements
We thank the referee for the very helpful suggestions. This work is part of the project Cosmic-Lab at the Physics and Astronomy Department “A. Righi” of the Bologna University (https://www.cosmic-lab.eu/Cosmic-Lab/Home.html). COH is supported by NSERC Discovery Grant RGPIN-2023-04264.
References
- Albrow, M. D., Gilliland, R. L., Brown, T. M., et al. 2001, ApJ, 559, 1060 [Google Scholar]
- Alvarez Garay, D. A., Fanelli, C., Origlia, L., et al. 2024, A&A, 686, A198 [NASA ADS] [CrossRef] [EDP Sciences] [Google Scholar]
- Baglio, M. C., Mainetti, D., D’Avanzo, P., et al. 2014, A&A, 572, A99 [NASA ADS] [CrossRef] [EDP Sciences] [Google Scholar]
- Bagnoli, T., in’t Zand, J. J. M., Galloway, D. K., & Watts, A. L. 2013, MNRAS, 431, 1947 [Google Scholar]
- Barr, E. D., Dutta, A., Freire, P. C. C., et al. 2024, Science, 383, 275 [Google Scholar]
- Bassa, C., Pooley, D., Homer, L., et al. 2004, ApJ, 609, 755 [NASA ADS] [CrossRef] [Google Scholar]
- Beccari, G., De Marchi, G., Panagia, N., & Pasquini, L., 2014, MNRAS, 437, 2621 [Google Scholar]
- Bhattacharyya, S., 2010, Adv. Space Res., 45, 949 [Google Scholar]
- Bressan, A., Marigo, P., Girardi, L., et al. 2012, MNRAS, 427, 127 [NASA ADS] [CrossRef] [Google Scholar]
- Cadelano, M., Pallanca, C., Ferraro, F. R., et al. 2015, ApJ, 807, 91 [Google Scholar]
- Cadelano, M., Pallanca, C., Ferraro, F. R., et al. 2017, ApJ, 844, 53 [NASA ADS] [CrossRef] [Google Scholar]
- Chevalier, C., & Ilovaisky, S. A., 1991, A&A, 251, L11 [NASA ADS] [Google Scholar]
- Choudhury, D., Salmi, T., Vinciguerra, S., et al. 2024, ApJ, 971, L20 [NASA ADS] [CrossRef] [Google Scholar]
- Corcoran, K. A., Ransom, S. M., Rosenthal, A. C., et al. 2024, arXiv e-prints [arXiv:2412.08688] [Google Scholar]
- Crociati, C., Valenti, E., Ferraro, F. R., et al. 2023, ApJ, 951, 17 [NASA ADS] [CrossRef] [Google Scholar]
- Crociati, C., Cignoni, M., Dalessandro, E., et al. 2024, A&A, 691, A311 [NASA ADS] [CrossRef] [EDP Sciences] [Google Scholar]
- Dalessandro, E., Crociati, C., Cignoni, M., et al. 2022, ApJ, 940, 170 [NASA ADS] [CrossRef] [Google Scholar]
- D’Angelo, C. R., & Spruit, H. C., 2010, MNRAS, 406, 1208 [NASA ADS] [Google Scholar]
- Edmonds, P. D., Gilliland, R. L., Heinke, C. O., Grindlay, J. E., & Camilo, F., 2001, ApJ, 557, L57 [Google Scholar]
- Edmonds, P. D., Gilliland, R. L., Camilo, F., Heinke, C. O., & Grindlay, J. E., 2002, ApJ, 579, 741 [NASA ADS] [CrossRef] [Google Scholar]
- Edmonds, P. D., Gilliland, R. L., Heinke, C. O., & Grindlay, J. E., 2003, ApJ, 596, 1177 [NASA ADS] [CrossRef] [Google Scholar]
- Ettorre, G., Dalessandro, E., Pallanca, C., et al. 2025, A&A, 697, A215 [NASA ADS] [CrossRef] [EDP Sciences] [Google Scholar]
- Fanelli, C., Origlia, L., Rich, R. M., et al. 2024, A&A, 690, A139 [NASA ADS] [CrossRef] [EDP Sciences] [Google Scholar]
- Ferraro, F. R., Possenti, A., D’Amico, N., & Sabbi, E., 2001, ApJ, 561, L93 [NASA ADS] [CrossRef] [Google Scholar]
- Ferraro, F. R., Dalessandro, E., Mucciarelli, A., et al. 2009, Nature, 462, 483 [Google Scholar]
- Ferraro, F. R., Pallanca, C., Lanzoni, B., et al. 2015, ApJ, 807, L1 [NASA ADS] [CrossRef] [Google Scholar]
- Ferraro, F. R., Massari, D., Dalessandro, E., et al. 2016, ApJ, 828, 75 [NASA ADS] [CrossRef] [Google Scholar]
- Ferraro, F. R., Pallanca, C., Lanzoni, B., et al. 2021, Nat. Astron., 5, 311 [Google Scholar]
- Ferraro, F. R., Chiappino, L., Bartolomei, A., et al. 2025, A&A, 696, A179 [NASA ADS] [CrossRef] [EDP Sciences] [Google Scholar]
- Fishman, G. J., 1995, AAS Meeting Abstracts, 186, 18.01 [Google Scholar]
- Fox, D. W., Lewin, W. H. G., Rutledge, R. E., et al. 2001, MNRAS, 321, 776 [Google Scholar]
- Frank, J., King, A., & Raine, D. J., 2002, Accretion Power in Astrophysics, 3rd edn. (Cambridge: Cambridge University Press) [Google Scholar]
- Fruchter, A. S., & Goss, W. M., 2000, ApJ, 536, 865 [Google Scholar]
- Gaia Collaboration (Brown, A. G. A., et al.,) 2018, A&A, 616, A1 [NASA ADS] [CrossRef] [EDP Sciences] [Google Scholar]
- Gaia Collaboration (Vallenari, A., et al.,) 2023, A&A, 674, A1 [NASA ADS] [CrossRef] [EDP Sciences] [Google Scholar]
- Galloway, D. K., & Keek, L., 2021, Astrophys. Space Sci. Lib., 461, 209 [NASA ADS] [CrossRef] [Google Scholar]
- Galloway, D. K., Muno, M. P., Hartman, J. M., Psaltis, D., & Chakrabarty, D., 2008, ApJS, 179, 360 [NASA ADS] [CrossRef] [Google Scholar]
- Guerriero, R., Fox, D. W., Kommers, J., et al. 1999, MNRAS, 307, 179 [Google Scholar]
- Heinke, C. O., Wijnands, R., Cohn, H. N., et al. 2006, ApJ, 651, 1098 [NASA ADS] [CrossRef] [Google Scholar]
- Heinke, C. O., Zheng, J., Maccarone, T. J., et al. 2025, ApJS, 279, 57 [Google Scholar]
- Hoffman, J. A., Marshall, H. L., & Lewin, W. H. G., 1978, Nature, 271, 630 [Google Scholar]
- Homer, L., Deutsch, E. W., Anderson, S. F., & Margon, B., 2001, AJ, 122, 2627 [Google Scholar]
- Huang, R. H. H., Becker, W., Edmonds, P. D., et al. 2010, A&A, 513, A16 [NASA ADS] [CrossRef] [EDP Sciences] [Google Scholar]
- in’t Zand, J. J. M., Hulleman, F., Markwardt, C. B.,, et al. 2003, A&A, 406, 233 [Google Scholar]
- in’t Zand, J. J. M., Bagnoli, T., D’Angelo, C., et al. 2017, arXiv e-prints [arXiv:1703.07221] [Google Scholar]
- Kawara, K., Hyland, A. R., & Wainscoat, R. J., 1984, Nature, 309, 770 [Google Scholar]
- Kennedy, M. R., Clark, C. J., Voisin, G., & Breton, R. P., 2018, MNRAS, 477, 1120 [NASA ADS] [CrossRef] [Google Scholar]
- King, A. R., & Ritter, H., 1998, MNRAS, 293, L42 [NASA ADS] [CrossRef] [Google Scholar]
- Kouveliotou, C., Kommers, J., Lewin, W. H. G., et al. 1996, IAU Circ., 6286, 1 [Google Scholar]
- Kremer, K., Fuller, J., Piro, A.L., & Ransom, S. M. 2023, MNRAS, 525, L22 [NASA ADS] [CrossRef] [Google Scholar]
- Kulkarni, P. V., Ashok, N. M., Apparao, K. M. V., & Chitre, S. M., 1979, Nature, 280, 819 [Google Scholar]
- Kumawat, G., Heinke, C. O., Cohn, H. N., & Lugger, P. M., 2024, MNRAS, 530, 82 [Google Scholar]
- Lanzoni, B., Ferraro, F. R., Dalessandro, E., et al. 2010, ApJ, 717, 653 [Google Scholar]
- Lasota, J.-P., 2001, New A Rev., 45, 449 [NASA ADS] [CrossRef] [Google Scholar]
- Lewin, W. H. G., Doty, J., Clark, G. W., et al. 1976, ApJ, 207, L95 [NASA ADS] [CrossRef] [Google Scholar]
- Lewin, W. H. G., van Paradijs, J., & Taam, R. E., 1993, Space Sci. Rev., 62, 223 [CrossRef] [Google Scholar]
- Lewin, W. H. G., van Paradijs, J., & Taam, R. E., 1995, in X-ray Binaries, eds. W. H. G. Lewin, J. van Paradijs, & E. P. J. van den Heuvel (UK: Cambridge University Press), 175 [Google Scholar]
- Liller, W., 1977, ApJ, 213, L21 [Google Scholar]
- Lugger, P. M., Cohn, H. N., Heinke, C. O., et al. 2023, MNRAS, 524, 2088 [NASA ADS] [CrossRef] [Google Scholar]
- Lyutikov, M., Barkov, M. V., & Giannios, D., 2020, ApJ, 893, L39 [NASA ADS] [CrossRef] [Google Scholar]
- Marino, A., Degenaar, N., Di Salvo, T., et al. 2018, MNRAS, 479, 3634 [Google Scholar]
- Marshall, H., & Lewin, W., 1978, IAU Circ., 3208, 2 [Google Scholar]
- Masetti, N., 2002, A&A, 381, L45 [NASA ADS] [CrossRef] [EDP Sciences] [Google Scholar]
- Mauviard, L., Guillot, S., Salmi, T., et al. 2025, arXiv e-prints [arXiv:2506.14883] [Google Scholar]
- McCarver, A. V., Maccarone, T. J., Ransom, S. M., et al. 2024, ApJ, 969, 30 [NASA ADS] [Google Scholar]
- Moore, C. B., Rutledge, R. E., Fox, D. W., et al. 2000, ApJ, 532, 1181 [Google Scholar]
- Negoro, H., Kohama, M., Serino, M., et al. 2016, PASJ, 68, S1 [Google Scholar]
- Origlia, L., Rich, R. M., & Castro, S., 2002, AJ, 123, 1559 [Google Scholar]
- Origlia, L., Massari, D., Rich, R. M., et al. 2013, ApJ, 779, L5 [NASA ADS] [CrossRef] [Google Scholar]
- Origlia, L., Ferraro, F. R., Fanelli, C., et al. 2025, A&A, 697, A19 [NASA ADS] [CrossRef] [EDP Sciences] [Google Scholar]
- Pallanca, C., Dalessandro, E., Ferraro, F. R., et al. 2010, ApJ, 725, 1165 [CrossRef] [Google Scholar]
- Pallanca, C., Dalessandro, E., Ferraro, F. R., Lanzoni, B., & Beccari, G., 2013, ApJ, 773, 122 [NASA ADS] [CrossRef] [Google Scholar]
- Pallanca, C., Beccari, G., Ferraro, F. R., et al. 2017, ApJ, 845, 4 [NASA ADS] [CrossRef] [Google Scholar]
- Pallanca, C., Ferraro, F. R., Lanzoni, B., et al. 2021, ApJ, 917, 92 [NASA ADS] [CrossRef] [Google Scholar]
- Patruno, A., Alpar, M. A., van der Klis, M., & van den Heuvel, E. P. J., 2012, ApJ, 752, 33 [Google Scholar]
- Pešta, M., & Pejcha, O., 2025, A&A, 696, A16 [NASA ADS] [CrossRef] [EDP Sciences] [Google Scholar]
- Ransom, S. M., Hessels, J. W. T., Stairs, I. H., et al. 2005, Science, 307, 892 [NASA ADS] [CrossRef] [PubMed] [Google Scholar]
- Rivera-Sandoval, L. E., van den Berg, M., Heinke, C. O., et al. 2015, MNRAS, 453, 2707 [Google Scholar]
- Romano, D., Ferraro, F. R., Origlia, L., et al. 2023, ApJ, 951, 85 [NASA ADS] [CrossRef] [Google Scholar]
- Russell, D. M., Fender, R. P., Hynes, R. I., et al. 2006, MNRAS, 371, 1334 [NASA ADS] [CrossRef] [Google Scholar]
- Sala, G., Haberl, F., José, J., et al. 2012, ApJ, 752, 158 [NASA ADS] [CrossRef] [Google Scholar]
- Saracino, S., Dalessandro, E., Ferraro, F. R., et al. 2015, ApJ, 806, 152 [NASA ADS] [CrossRef] [Google Scholar]
- Simon, V., 2006, ESA SP, 604, 301 [Google Scholar]
- Spruit, H. C., & Taam, R. E., 1993, ApJ, 402, 593 [CrossRef] [Google Scholar]
- Stetson, P. B., 1987, PASP, 99, 191 [Google Scholar]
- Stetson, P. B., 1994, PASP, 106, 250 [Google Scholar]
- Tauris, T. M., Sanyal, D., Yoon, S. C., & Langer, N., 2013, A&A, 558, A39 [NASA ADS] [CrossRef] [EDP Sciences] [Google Scholar]
- Valenti, E., Ferraro, F. R., & Origlia, L., 2010, MNRAS, 402, 1729 [NASA ADS] [CrossRef] [Google Scholar]
- van den Eijnden, J., Robins, D., Sharma, R., et al. 2024, MNRAS, 533, 756 [Google Scholar]
- van Paradijs, J., & McClintock, J. E., 1994, A&A, 290, 133 [NASA ADS] [Google Scholar]
- Verbunt, F., & Hut, P., 1987, IAU Symp., 125, 187 [NASA ADS] [Google Scholar]
- Zhang, S. B., Wang, J. S., Yang, X., et al. 2024, Nat. Comm., 15, 7454 [Google Scholar]
European Southern Observatory/The New Technology Telescope.
Hubble Space Telescope/Near Infrared Camera and Multi-Object Spectrometer.
Advanced Camera for Survey – Wide Field Camera.
Monitor of All-sky X-ray Image.
All Tables
Most recent X-ray and radio-band positions of the RB, and coordinates of its candidate optical counterpart.
All Figures
|
Fig. 1 HST/ACS (left panel) and VLA (right panel; https://zenodo.org/records/12806382) images of the 4′′ × 4′′ region centered on the X-ray position of the RB quoted in Table 1. The crosses mark the coordinates listed in the table, and the ellipses have axes equal to three times the quoted uncertainties. Red, blue and cyan correspond to the values obtained for the candidate optical counterpart (this work), the X-ray, and the radio-band positions of the RB (Homer et al. 2001; van den Eijnden et al. 2024, respectively). North is up, and east is to the left. |
| In the text | |
|
Fig. 2 Images of the 2′′ × 2′′ region surrounding the candidate optical counterpart to the RB (white circle) acquired at different times. The top and bottom panels show HST/ACS images in the F814W filter and Ks-band GeMS images, respectively. For visualization purposes, a 2-pixel smoothing has been applied to the F814W images. The images in the right panels were acquired approximately 1.5−2 hours after those in the left panels. The corresponding changes in magnitudes are about ∼ 0.4 mag for the Ks band (bottom row) and ∼ 0.5 mags for the F814W filter (top row). |
| In the text | |
|
Fig. 3 Magnitude scatter measured for all the stars located within 20′′ (gray dots) from the RB X-ray position as a function of their magnitude. The black circles highlight all the sources detected within a distance of just 1.5′′ from the RB. The large red star marks the candidate optical counterpart. The top, middle, and bottom panels refer to the F606W, F814W, and Ks filters, respectively. |
| In the text | |
|
Fig. 4 Magnitude differences with respect to the mean value in the F606W, F814W, and Ks filters (top, middle, and bottom panels, respectively) as a function of time. The latter is calculated in hours with respect to the reference MJD marked in each panel. The error bars for the magnitudes are displayed and are comparable in size to the plotted symbols. |
| In the text | |
|
Fig. 5 Differential-reddening-corrected and proper-motion-selected CMD of all the stars detected within 20′′ from the RB X-ray position (gray dots). The black circles and the large red star highlight the sources located within a distance of 1.5′′ and the candidate optical counterpart to the RB, respectively. The red and blue lines (see also legend) are a 12 Gyr old isochrone (Bressan et al. 2012) with [M/H]=−0.3 (well reproducing the old subpopulation of Liller 1), and two 1–2 Gyr old isochrones with [M/H]=+0.3 (tracing the young and supersolar subpopulation), respectively. |
| In the text | |
Current usage metrics show cumulative count of Article Views (full-text article views including HTML views, PDF and ePub downloads, according to the available data) and Abstracts Views on Vision4Press platform.
Data correspond to usage on the plateform after 2015. The current usage metrics is available 48-96 hours after online publication and is updated daily on week days.
Initial download of the metrics may take a while.