Fig. 2
Download original image
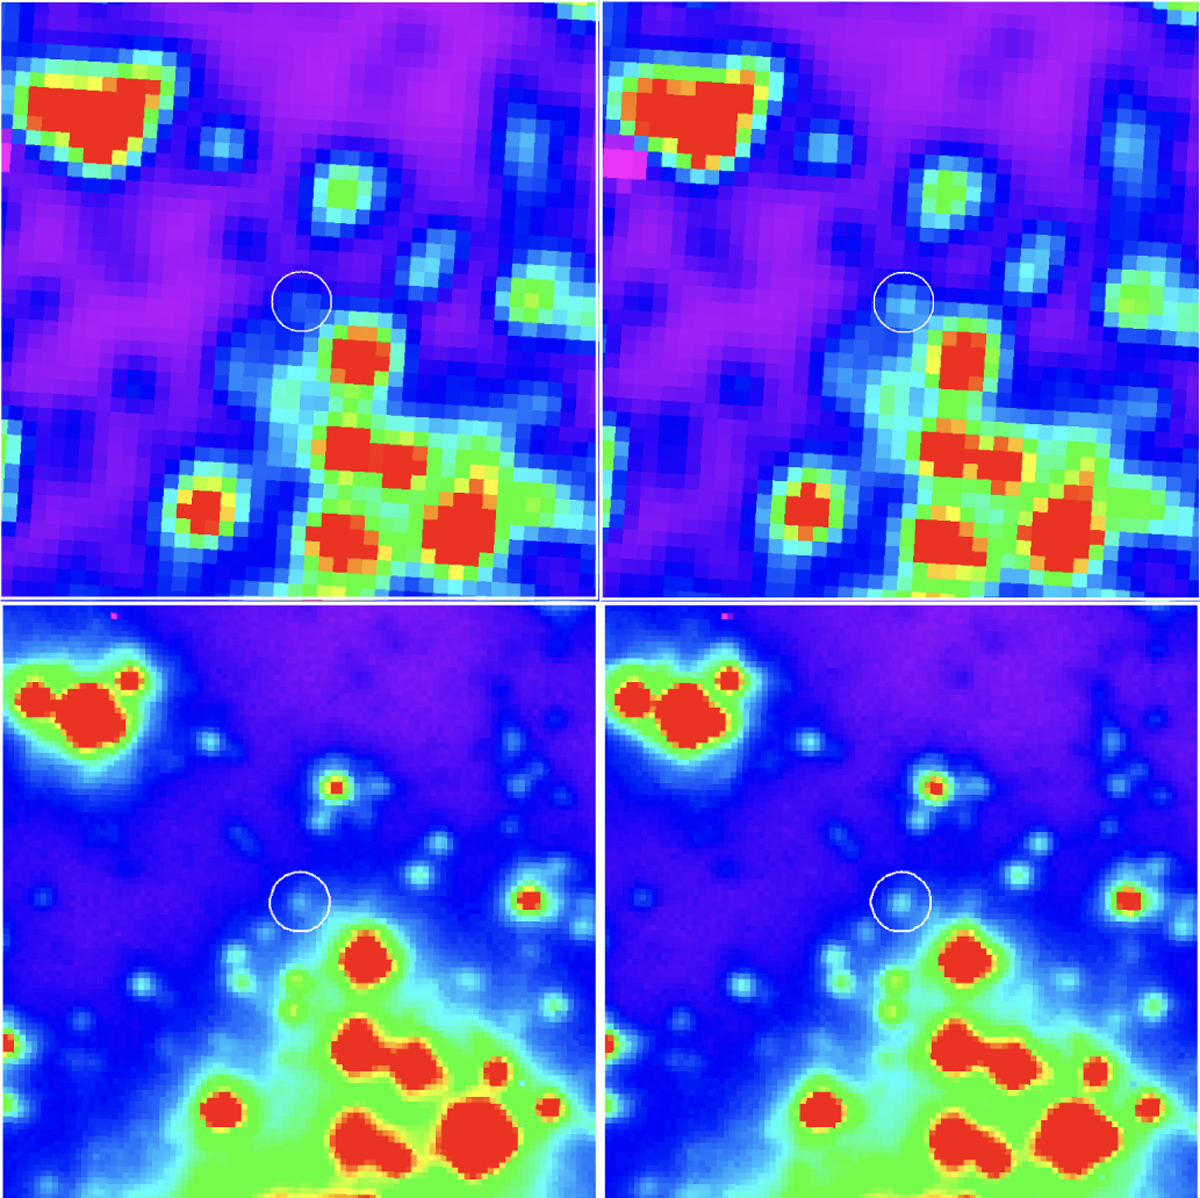
Images of the 2′′ × 2′′ region surrounding the candidate optical counterpart to the RB (white circle) acquired at different times. The top and bottom panels show HST/ACS images in the F814W filter and Ks-band GeMS images, respectively. For visualization purposes, a 2-pixel smoothing has been applied to the F814W images. The images in the right panels were acquired approximately 1.5−2 hours after those in the left panels. The corresponding changes in magnitudes are about ∼ 0.4 mag for the Ks band (bottom row) and ∼ 0.5 mags for the F814W filter (top row).
Current usage metrics show cumulative count of Article Views (full-text article views including HTML views, PDF and ePub downloads, according to the available data) and Abstracts Views on Vision4Press platform.
Data correspond to usage on the plateform after 2015. The current usage metrics is available 48-96 hours after online publication and is updated daily on week days.
Initial download of the metrics may take a while.