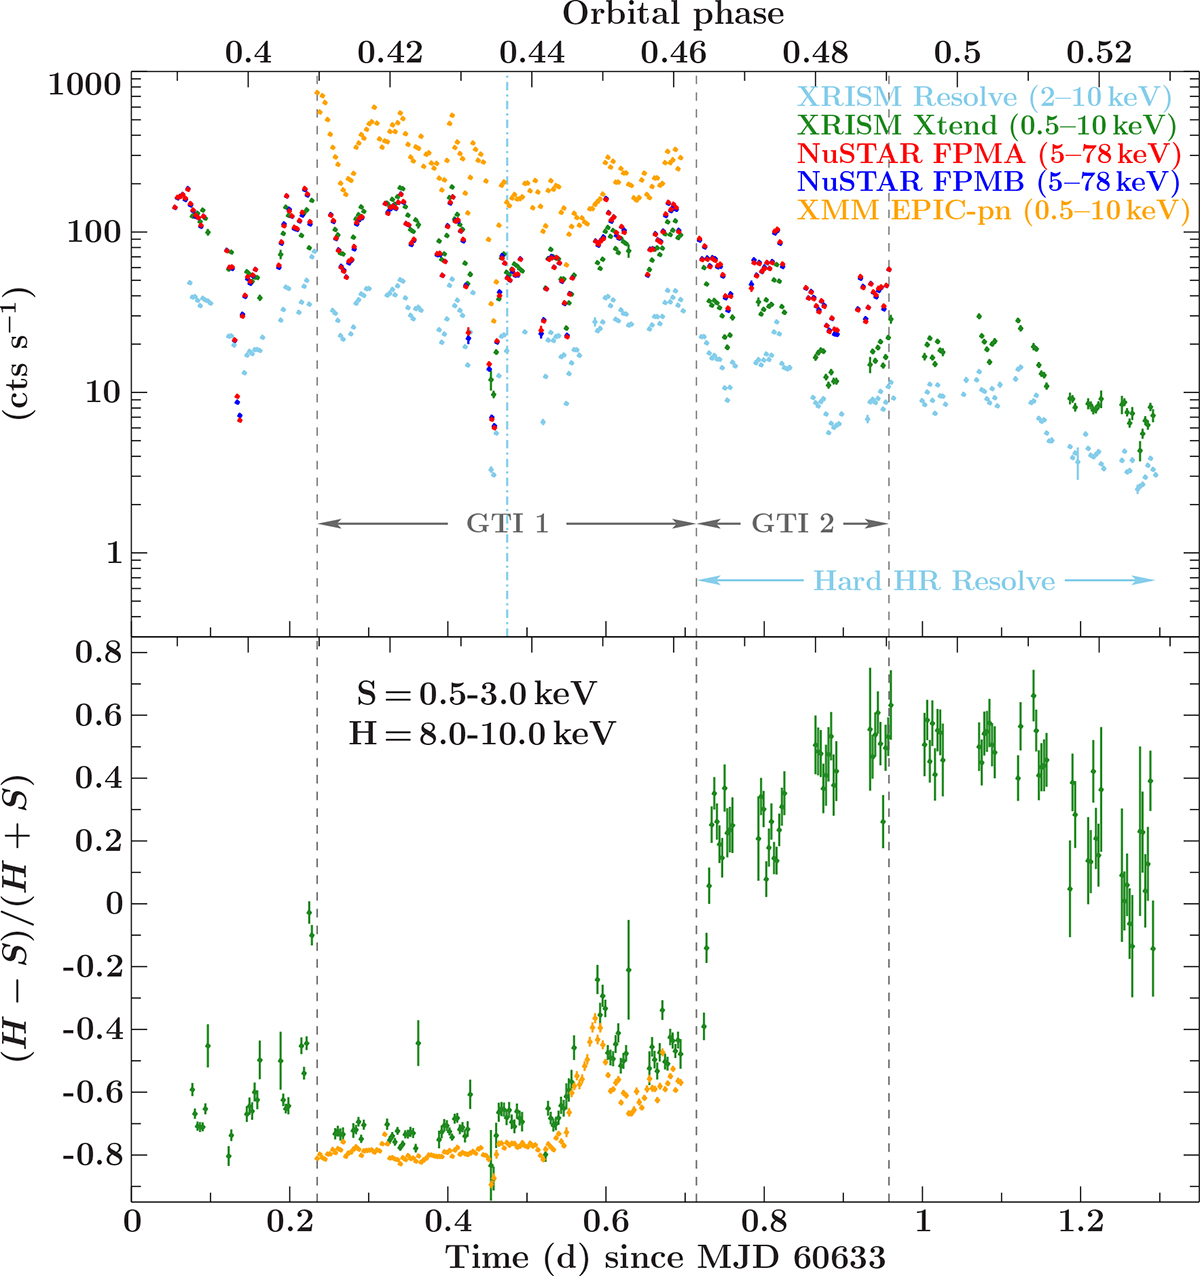
Fig. 2.
Download original image
Light curves and hardness ratio for XRISM/Resolve (light blue) and Xtend (green), XMM-Newton/EPIC-pn (orange), and NuSTAR/FPMA (red) and FPMB (blue) with a time resolution of P = 283.595 s. Top panel: Overall count rates in the energy bands corresponding to the respective instruments. The black dashed vertical lines denote the two GTIs we chose for our spectral analysis (Sect. 3.2 and Sect. 3.3). The dash-dotted light blue line marks the end of the FW electronics error, i.e. the beginning of the well-calibrated XRISM/Resolve data for our spectral analysis (Sect. 3.4). Bottom panel: Hardness ratio between the 0.5–3 keV (soft) and 8–10 keV (hard) energy bands.
Current usage metrics show cumulative count of Article Views (full-text article views including HTML views, PDF and ePub downloads, according to the available data) and Abstracts Views on Vision4Press platform.
Data correspond to usage on the plateform after 2015. The current usage metrics is available 48-96 hours after online publication and is updated daily on week days.
Initial download of the metrics may take a while.