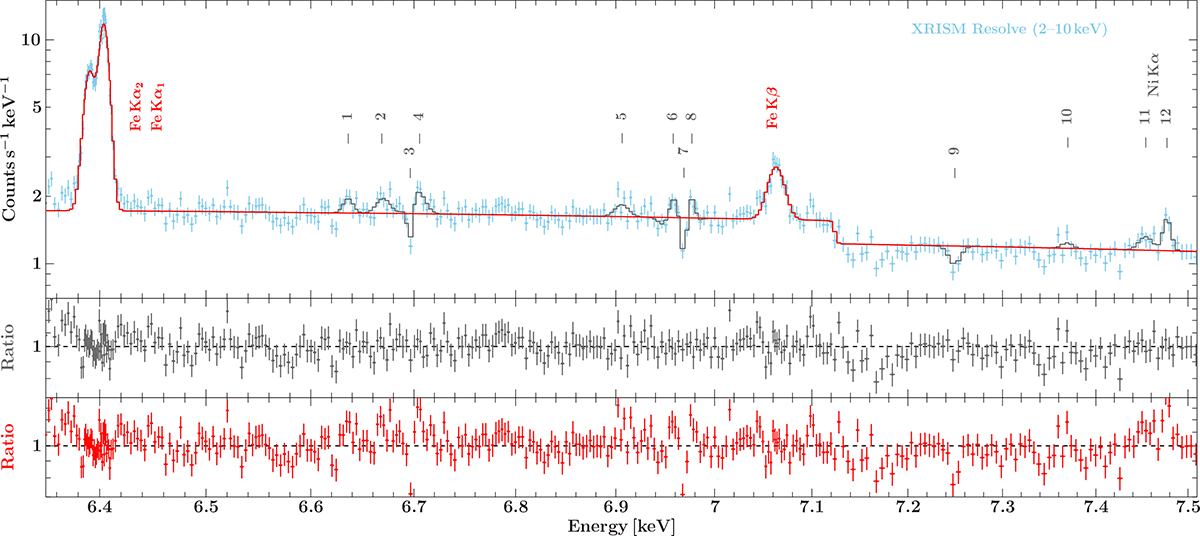
Fig. 3.
Download original image
Folded XRISM/Resolve spectrum (light blue) averaged over the hard HR interval. The red solid line corresponds to the base model we used to test for the presence of additional line components, indicated by the grey solid line (see Sect. 3.4.2). Lines for which a detection could be resolved are labelled by their names; the others are labelled by numbers. The corresponding ratio residuals in the lower panels are computed as data/model. For plotting purposes, the data were binned to a minimum of 150 counts/bin.
Current usage metrics show cumulative count of Article Views (full-text article views including HTML views, PDF and ePub downloads, according to the available data) and Abstracts Views on Vision4Press platform.
Data correspond to usage on the plateform after 2015. The current usage metrics is available 48-96 hours after online publication and is updated daily on week days.
Initial download of the metrics may take a while.