Fig. B.1.
Download original image
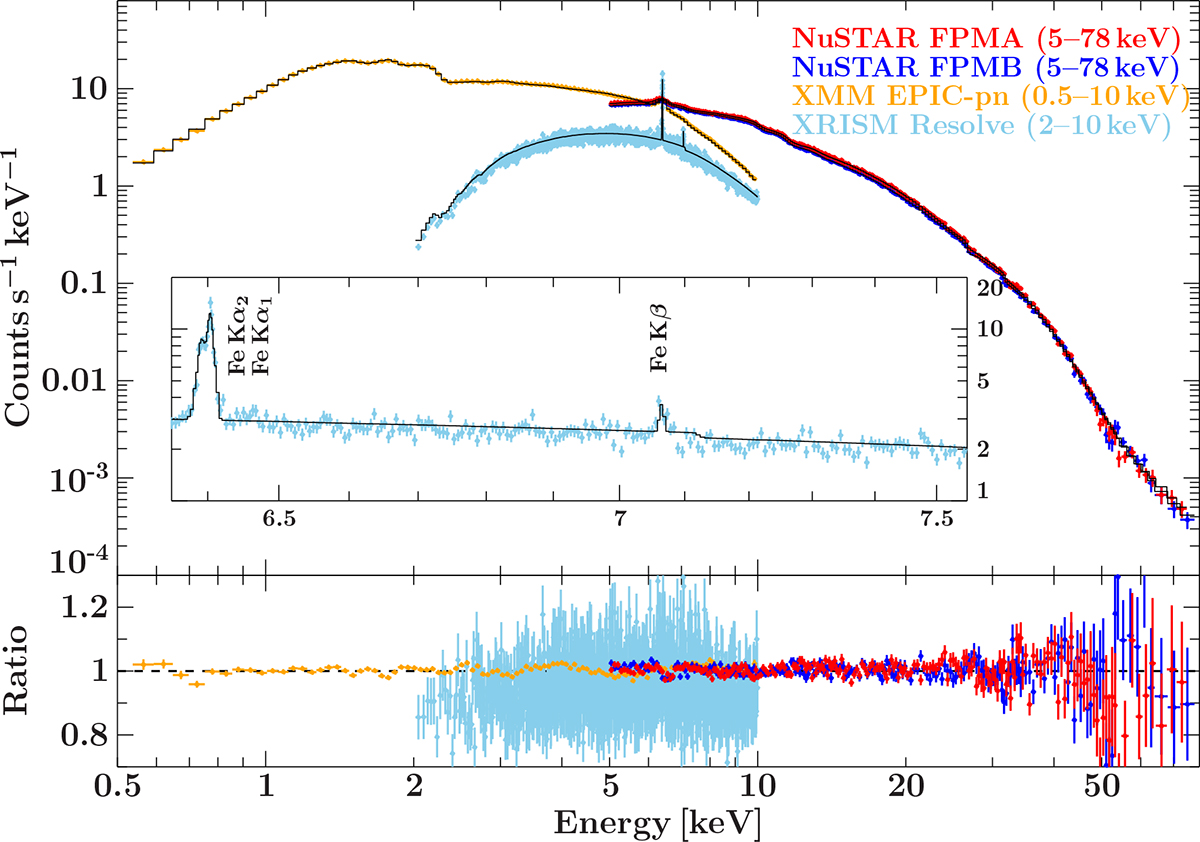
Folded spectra for GTI 1 obtained with XMM-Newton/EPIC-pn (orange), NuSTAR/FPMA (red) and FPMB (dark blue), and XRISM/Resolve (light blue). Solid lines show the best-fit model and corresponding ratio in the bottom panel computed as data/model. A zoom in the Fe region is shown to highlight the resolution capabilities of Resolve. For plotting and readability purposes, the NuSTAR and XMM-Newton data are not displayed in the zoomed window and the XRISM/Resolve data are binned to a minimum of 150 counts/bin.
Current usage metrics show cumulative count of Article Views (full-text article views including HTML views, PDF and ePub downloads, according to the available data) and Abstracts Views on Vision4Press platform.
Data correspond to usage on the plateform after 2015. The current usage metrics is available 48-96 hours after online publication and is updated daily on week days.
Initial download of the metrics may take a while.