Fig. 1.
Download original image
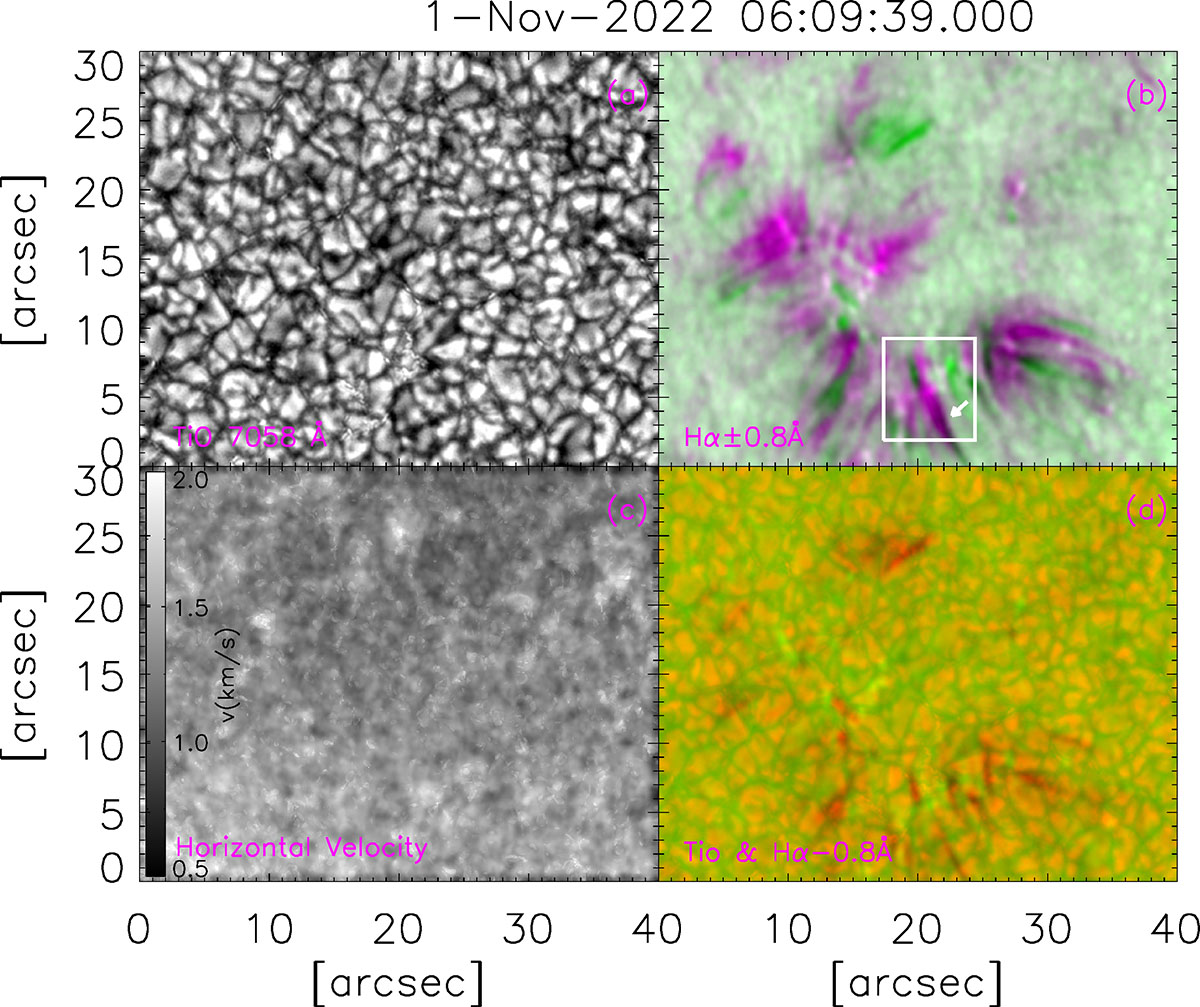
Context images for regions studied in the present work, taken on November 1, 2022. Panel a: Continuum intensity map in the TiO passband. Panel b: Same region in the composite image of Hα +0.8 Å (blue) and Hα −0.8 Å (pink). The Hα jet enclosed by the white box is a recurrent example, presented in detail in Fig. 3. Panel c: Average horizontal velocity field during the observation period estimated by FLCT. Panel d: Composite image of the Hα −0.8 Å image (red) and the TiO 7058 Å image (green) at 12:19:31 UT. An animated version of this figure is available online.
Current usage metrics show cumulative count of Article Views (full-text article views including HTML views, PDF and ePub downloads, according to the available data) and Abstracts Views on Vision4Press platform.
Data correspond to usage on the plateform after 2015. The current usage metrics is available 48-96 hours after online publication and is updated daily on week days.
Initial download of the metrics may take a while.