| Issue |
A&A
Volume 703, November 2025
|
|
|---|---|---|
| Article Number | A281 | |
| Number of page(s) | 7 | |
| Section | The Sun and the Heliosphere | |
| DOI | https://doi.org/10.1051/0004-6361/202556245 | |
| Published online | 21 November 2025 | |
Dynamics of granules and intergranular lanes at the base of Hα jets
1
Shandong Key Laboratory of Space Environment and Exploration Technology, Institute of Space Sciences, Shandong University, Shandong, China
2
National Key Laboratory of Deep Space Exploration, School of Earth and Space Sciences, University of Science and Technology of China, Hefei 230026, China
3
CAS Center for Excellence in Comparative Planetology/CAS Key Laboratory of Geospace Environment/Mengcheng National Geophysical Observatory, University of Science and Technology of China, Hefei 230026, China
4
Yunnan Observatories, Chinese Academy of Sciences, 396 Yangfangwang, Guandu District, Kunming 650216, PR China
5
Yunnan Key Laboratory of Solar Physics and Space Science, Kunming 650216, PR China
6
Center for Integrated Research on Space Science, Astronomy, and Physics, Institute of Frontier and Interdisciplinary Science, Shandong University, Qingdao 266237, China
⋆⋆ Corresponding author: This email address is being protected from spambots. You need JavaScript enabled to view it.
Received:
4
July
2025
Accepted:
26
September
2025
Abstract
Aims. Using observations taken by the New Vacuum Solar Telescope at the Hα ±0.8 Å passbands and TiO 7058 Å passband, we investigate the photospheric dynamics at the bases of 85 Hα jets.
Methods. By applying the Fourier local correlation tracking algorithm on the TiO data, we find that the horizontal velocities increase significantly at the bases of an Hα jet during its appearance, and the statistics for these Hα jets at their bases gives an average of 1.50 km s−1 with a sigma of 0.64 km s−1, which is about 25% greater than the typical value of the granules. We find that the intergranular lanes at the bases of Hα jets are expanding, with an expansion rate up to 300%. With the automated swirl detection algorithm, we find that the occurrence rate of photospheric swirls in the region abundant in Hα jets is 2.0 × 10⁻⁵ Mm−2 s−1, significantly larger than 1.4 × 10⁻⁵ Mm−2 s−1 obtained in the rest of the studied field of view.
Results. In the region abundant in Hα jets, 61.2% of swirls are expanding. By contrast, in the rest of the field of view, only 52.3% of swirls are expanding. Although a definitive one-to-one relationship among Hα jets, dynamics of granules and intergranules, and swirls remains challenging, a case study shows that the appearance of an Hα jet is apparently associated with the occurrence and rotation of a swirl and the expansion of the intergranular lane, while the disappearance of the jet is accompanied by the contraction of the intergranular lane.
Conclusions. Based on our statistical analyses, we suggest that higher horizontal velocity sweeps more small magnetic elements into network lanes, leading to stronger magnetic activity and consequently the expansion of intergranular lanes and swirls, which in turn further drives Hα jets in the chromosphere.
Key words: Sun: chromosphere / Sun: granulation
Now at: Institute of Science and Technology for Deep Space Exploration, Suzhou Campus, Nanjing University, Suzhou 215163, People’s Republic of China.
© The Authors 2025
 Open Access article, published by EDP Sciences, under the terms of the Creative Commons Attribution License (https://creativecommons.org/licenses/by/4.0), which permits unrestricted use, distribution, and reproduction in any medium, provided the original work is properly cited.
This article is published in open access under the Subscribe to Open model. This email address is being protected from spambots. You need JavaScript enabled to view it. to support open access publication.
1. Introduction
Fine and dynamic jet-like features are ubiquitous phenomena in the solar chromosphere, which may play an important role in linking the photosphere and the corona. These chromospheric jets may be referred to by different names depending on the circumstances, such as spicules at the solar limb, dynamic fibrils in active plage regions, and mottles in the quiet Sun. For spicules, de Pontieu et al. (2007a) found two types. Type-I spicules have lifetimes of 150−400 s, heights of 4−8 Mm, and velocities of 15−40 km s−1. Type-II spicules are smaller and shorter-lived and have higher speeds than Type-I spicules. In active plage regions, fibrils appear as dynamic and jet-like features, which are similar to traditional Type-I spicules (e.g., Hansteen et al. 2006; De Pontieu et al. 2007). These dynamic fibrils show quasiperiodicity with a lifetime of 3−6 minutes, they undergo ascent and descent motions with a velocity of 10−35 km s−1. In quiet-Sun regions, mottles appear as dark and spicule-like features against the disk observed at the wings of the Hα line. The trajectory of a mottle normally follows a parabolic path (e.g., Rouppe van der Voort et al. 2007; de Pontieu et al. 2007b). Recently, Qi et al. (2022) analyzed chromospheric jets exiting the chromospheric network region observed in Hα with the New Vacuum Solar Telescope (NVST, Liu et al. 2014). These jets cluster in rosette-like structures. They found that those Hα jets have average lifetimes, heights, and ascending speeds of 75.38 s, 2.67 Mm, and 65.60 km s−1, respectively, consistent with those of spicules.
Several potential mechanisms have been proposed for the formation of these fine jets. These formation mechanisms include upward-propagating, shock-driven pressure waves that originate from the photosphere and leak into the chromosphere (Hollweg 1982; Zhang et al. 2024); photospheric oscillations and convective motions that extend into the chromosphere (Hansteen et al. 2006; De Pontieu et al. 2007); magnetic reconnection between unipolar magnetic features and nearby small-scale bipolar regions in the photosphere (Ding et al. 2011; Samanta et al. 2019); and the Lorentz force exerted by twisted magnetic field lines (Iijima & Yokoyama 2017; Martínez-Sykora et al. 2017; Yadav et al. 2021). In any case, each of these mechanisms is strongly connected to the dynamics of the photosphere.
The solar photosphere is predominantly defined by granular patterns. Granules are bright patterns surrounded by narrow dark lanes, namely intergranular lanes. The horizontal velocities of the granules are typically approximately 0.5 km s−1 (see e.g., Abramenko et al. 2012; Bellot Rubio & Orozco Suárez 2019, for extensive overviews). The dynamics of granules is coupled with magnetic field evolution in the solar atmosphere. Zhang et al. (2009) investigated the relationship between granule development and magnetic field evolution, and they found that granular motions and small-scale magnetic elements significantly influence each other. Granular flow advects the evolution of magnetic flux, potentially leading to magnetic reconnection and driving upward flows. With observations from the New Solar Telescope (NST; Goode et al. 2010), Yurchyshyn et al. (2011) found that jets originating from the intergranular lanes tend to occur at granule boundaries, where the formation and evolution of horizontal vortex tubes within individual granules are associated. Several studies have found that the granular patterns associated with these jets exhibit faster advection flows (∼2 km s−1), which are believed to trigger magnetic reconnection and subsequently initiate these jets (Goode et al. 2010; Zeng et al. 2013). Moreover, these jets show a periodicity of ∼5 minutes, which are associated with periodic EUV brightenings and magnetoacoustic oscillations with roughly the same period (Ji et al. 2012; Hashim et al. 2021; Wang et al. 2021; Hong et al. 2022). Yet, these studies have primarily been case analyses. To comprehensively understand the evolution of granule patterns as chromospheric jets ascend, a statistical approach is necessary.
Vortex flows are also common in the solar photosphere. Bonet et al. (2008) first observed convectively driven vortex flows at smaller scales within intergranular lanes. Wang et al. (1995) and Attie et al. (2009) proposed that these small-scale vortex flows might form as a natural consequence of granular flows. These swirls are capable of exciting torsional Alfvén waves (see e.g., Jess et al. 2009, 2015; Morton et al. 2015, for extensive overviews), which can support dynamic chromospheric jets and play a key role in the supply of energy to the upper solar atmosphere (see e.g., De Pontieu et al. 2012; Park et al. 2016; Iijima & Yokoyama 2017; Liu et al. 2019a; Yadav et al. 2020, 2021, etc.). The distribution range of vortex sizes is very wide. Attie et al. (2009) found that large-scale swirls had diameters ranging from 15.5 Mm to 21 Mm, with lifetimes exceeding 1 hour. Based on a state-of-the-art algorithm, the automated swirl detection algorithm (ASDA), Liu et al. (2019b) found that the average diameter of swirls was approximately 290 km. Moreover, they determined that 69%−78% of swirls had lifetimes less than 12.84 s, with an overall average lifetime of ∼20 s.
Such vortex flows might be an important driver of chromospheric jets, as demonstrated by numerous numerical studies (see e.g., Tziotziou et al. 2023, for extensive overviews). Kuridze et al. (2016) and Iijima & Yokoyama (2017) indicated that vortices could drive the formation of observed chromospheric jet-like features, with the Lorentz force of twisted magnetic field lines playing a crucial role in their production. Snow et al. (2018) showed that swirl motions at photospheric layers could generate magnetic substructures and trigger shocks between merging flux tubes. These shocks in turn may serve as a driving force for chromospheric jets and also play a role in heating the chromosphere.
Observational investigations into the relationship between the dynamics of granules and chromospheric jets remain under-explored. In this paper, we use observations at the Hα and TiO passbands from NVST to investigate the dynamics of granules and intergranular lanes at the bases of Hα jets. We mainly analyze the horizontal velocities of granules and the areas of the intergranular lanes. We also employ the ASDA method to identify swirls in the photosphere and also investigate their possible connections with Hα jets. These analyses are carried out in a statistical manner, and a few individual cases are also presented. The rest of the paper is organized as follows: The observations and methodology are described in Sect. 2. The results are presented and discussed in Sect. 3, and the conclusions are summarized in Sect. 4.
2. Observations and data analyses
The NVST dataset analyzed in this study was obtained on November 1, 2022, from 06:07 UT to 06:47 UT. The target of the observations is an on-disk coronal hole (Liu et al. 2014). The observations include filtergrams in the Hα ±0.8 Å with a bandpass of 0.25 Å and in the TiO filter at 7058 Å with a bandpass of 10 Å.
The studied field of view covers a 41″ × 31″ region. All raw data were first calibrated to Level 1 by subtracting dark currents and applying flat field corrections. Subsequently, the data were reconstructed to Level 1+ using the speckle reconstruction method (Weigelt 1977). The high-resolution reconstruction process is described in detail by Xiang et al. (2016). The stabilization of all NVST image series was executed using a fast sub-pixel image registration algorithm developed by the instrument team (Yang et al. 2015). All NVST images were co-aligned, and poor-quality images were manually removed and replaced with artificial images generated by interpolating adjacent good frames. After data reduction, the Hα images have a cadence of 45 s and a spatial scale of 0.165 arcsec/pixel, while the TiO images have a cadence of 30 s and a spatial scale of 0.052 arcsec/pixel.
Fig. 1a and the associated animation display the evolution of granules in the TiO 7058 Å. To obtain the horizontal velocity of the photosphere, the Fourier local correlation tracking method (FLCT, Fisher & Welsch 2008) was utilized on the time series of the TiO data. Fig. 1c and the associated animation show the average horizontal velocity during the observation period. Fig. 1b shows the same region in the composite image of Hα +0.8 Å (blue) and Hα −0.8 Å (pink). In Fig. 1b and the associated animation, we can see a high number of Hα jets (dark spicular features) rooted in the chromospheric network. These Hα jets were identified and traced by an upgraded automatic algorithm (Huang et al. 2017; Qi et al. 2019, 2022). Based on the identifications, we are able to obtain the full trajectories and evolution of the jets, including their birth times and heights. Fig. 1d and the associated animation show these jets from the intergranular lanes, which might result from swirls within these lanes. Using ASDA (Liu et al. 2019b), we will derive parameters of the swirls, including their locations, radii, rotation speeds, expanding and contracting speeds.
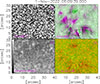 |
Fig. 1. Context images for regions studied in the present work, taken on November 1, 2022. Panel a: Continuum intensity map in the TiO passband. Panel b: Same region in the composite image of Hα +0.8 Å (blue) and Hα −0.8 Å (pink). The Hα jet enclosed by the white box is a recurrent example, presented in detail in Fig. 3. Panel c: Average horizontal velocity field during the observation period estimated by FLCT. Panel d: Composite image of the Hα −0.8 Å image (red) and the TiO 7058 Å image (green) at 12:19:31 UT. An animated version of this figure is available online. |
In the field of view, we were able to identify and trace 85 Hα jets during the observing period. We then turned our focus on the photospheric dynamics, as determined from the TiO images near the time at which these jets appeared. These include the horizontal flows, the evolution of granules and intergranular lanes at the footpoints of these jets, and the swirls in the regions around their footpoints.
3. Results and discussion
3.1. Horizontal flows and granular dynamics
For each Hα jet, we used the combined image of Hα +0.8 Å and Hα −0.8 Å (Fig. 1b) to determine its footpoint. We find that most of these jets are rooted in network lanes, in agreement with previous studies. The photospheric horizontal velocity of each jet was obtained by averaging a region of 8 pixels × 8 pixels at its footpoint. In Fig. 2a, we show the statistics of the photospheric horizontal velocities of 85 identified Hα jets near the moment at which they appeared. The distribution of these horizontal velocities ranges from 0.2−3 km s−1, with an average of 1.5 km s−1 and a sigma of 0.64 km s−1. This is slightly higher than the mean velocity of the entire field of view over the observation period, which is calculated to be 1.2 km s−1. About 67% of these jets have photospheric horizontal velocities greater than 1.2 km s−1. These numbers are consistent with the properties of magnetic elements, which have horizontal velocities of 1.57 ± 0.08 km s−1 (de Wijn et al. 2008) and may reach up to 3 km s−1 at their emerging stages (Martínez González & Bellot Rubio 2009; Manso Sainz et al. 2011). Our results suggest that these Hα jets are associated with activities of magnetic elements in the network lane.
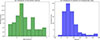 |
Fig. 2. Panel a: Statistics of photospheric horizontal velocities at the footpoints of 85 identified Hα jets near their times of appearance. The dashed yellow line indicates the average velocity of the entire field of view over observation period. Panel b: Statistics of variations in the areas of intergranular lanes at the footpoints of the Hα jets. |
We also trace variations in the area of the intergranular lane at the footpoint of each jet, where the edge of the intergranular lane is defined as location where the TiO intensity drops to one sigma below the average intensity of the entire field of view. For each jet, we define the area change ratio ( ), where S1 is the area of the intergranular lane at the time the jet was present, and S0 is the area measured in the preceding frame. The statistics of ρ are shown in Fig. 2b, from which it is evident that the intergranular lanes at the footpoints of almost all jets were expanding, while the Hα jets occurred. The distribution of ρ peaks at about 50%, and it can reach up to 300%.
In Fig. 3, we present a case of jets recurring from the same location, with a total of six Hα jets detected between 06:12 UT and 06:46 UT (see the dark features indicated by arrows). From Figs. 3a–f, we can see that these recurring jets exhibit consistent extension directions. In the bottom panel of Fig. 3, we show variations in the horizontal velocities at the footpoint region of these recurring jets. Clear enhancements in horizontal velocities are observed when an Hα jet is present (see the peaks denoted by the dashed red lines). In Table 1, we provide a detailed overview of the parameters associated with these recurring Hα jets. The widths and heights of these jets range from 327−426 km and 2.15−3.13 Mm, respectively. The photospheric horizontal velocities at their footpoints range from 1.54 to 1.75 km s−1. The change rates of the intergranular areas, defined as the area changes per unit time, rage from 7 − 40 × 10−4 Mm2 s−1. This case of recurring jets clearly shows the connection between the dynamics of the granules and the presence of Hα jets. These results agree with the scenario proposed by Zeng et al. (2013), in which rapidly developing granules with stronger advecting flows give rise to chromospheric fine structures. Granular motions and small-scale magnetic elements influence each other; magnetic elements can be advected by the horizontal granular motion and often emerge in conjunction with the rapid evolution of granules (Zhang et al. 2009). Higher granular flows may push the emerged small-scale magnetic elements toward the intergranular lane, thereby triggering magnetic reconnection (see e.g., Zhang et al. 2009; Zeng et al. 2013), which then generates Hα jets.
Parameters associated with six recurring jets.
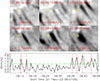 |
Fig. 3. Panels a–f: Six recurrent Hα jets (dark features indicated by yellow arrows) observed between 06:12 UT and 06:46 UT. The bottom panel shows the variations in horizontal velocities at the footpoints of the recurrent jets, with dashed red lines marking the times when an Hα jet appears. The dashed green line denotes the average velocity level across the field of view. |
3.2. Statistics for swirls in the photosphere
In accordance with the methodology described by Liu et al. (2019b), Xie et al. (2025), identifying photospheric swirls involves two sequential steps: First, the FLCT algorithm is employed to estimate the photospheric velocity field; second, the ASDA is applied to detect swirls within this field. The ASDA algorithm relies on two key metrics, Γ1 and Γ2, which are computed for each point in the velocity field, using 49 surrounding reference points (Graftieaux et al. 2001). In particular, the condition for swirl centers is |Γ1|≥0.89, while the condition for boundaries is |Γ2|≥2/π. Both positive and negative values of Γ1 and Γ2 correspond to specific rotational directions: Positive values indicate counterclockwise rotation, while negative values denote clockwise rotation. Additionally, this detection process enables the extraction of swirl characteristics, including spatial locations, effective radii, rotation speeds, expansion and contraction speeds.
Fig. 4 presents an example of the photospheric density distribution (in grayscale), with the velocity field estimated by FLCT overlaid as red arrows. The blue and green curves mark the boundaries of the detected swirls using ASDA. We detect a total of 1431 swirls in the field of view during the observing period. In Fig. 5a, we indicate the locations of these swirls with plus signs on an Hα image. On the image, we use red plus signs to denote the swirls (in total 291) occurring in the regions where Hα jets are present and use light blue plus signs to mark those (in total 1140) occurring in the region devoid of Hα jets. The birthrate of swirls for the Hα jet region is 2.0 × 10⁻⁵ Mm−2 s−1 and that for the rest is 1.4 × 10⁻⁵ Mm−2 s−1.
 |
Fig. 4. Detected swirls. The background represents the photospheric intensity. Red arrows indicate the horizontal velocity field estimated by FLCT. Green (blue) lines denote the edges of the detected swirls with counterclockwise (clockwise) rotations. |
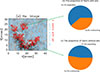 |
Fig. 5. Panel a: Locations of all photospheric swirls on an Hα image (plus symbols). Red pluses represent swirls in the region abundant in Hα jets and light blue pluses represent swirls in the rest of the field of view. Panels b and c: Pie charts of the proportions of expanding and contracting swirls in the two regions. |
We conduct a statistical analysis of the parameters of these swirls, including velocities and radii. The velocity encompasses both the rotational speed, the expansion and contraction speed. In the region abundant in Hα jets, 161 swirls (55.3%) rotate counterclockwise with an average rotational speed of approximately 1.00 km s−1, while the remaining 130 (44.7%) rotate clockwise with an average speed of approximately −1.01 km s−1. In the rest of the field of view, 592 swirls (52.3%) rotate counterclockwise with an average speed of approximately 1.05 km s−1, while 548 (48.7%) rotate clockwise with an average speed of approximately −1.03 km s−1. Figs. 5b and c display the proportion of expanding and contracting swirls in the two regions. In the region abundant in Hα jets, the number of expanding swirls accounts for 61.2%, and their average expansion speed is ∼0.19 km s−1. In the same region, the number of contracting swirls accounts for 38.8%, and their average contraction speed is ∼0.18 km s−1. In the rest of the region, the number of expanding swirls is 47.5% with an average speed of 0.19 km s−1, and the number of contracting swirls is 52.5% with an average speed of 0.20 km s−1. These results indicate no significant difference in the rotational, expanding and contracting dynamics of these two groups of swirls. However, these clearly show that the swirls occurring in the region abundant in Hα jets have a higher proportion of expansion than those in the rest of the field of view.
The distributions of the radii of swirls in these two regions are almost identical. The radii of these swirls range from 150 to 550 km, with an average radius of 274.0 ± 60.8 km. The sizes of swirls fall within the intermediate range of the width of spicules (Tziotziou et al. 2023, for extensive overviews). The parameters of the swirls identified here are well in agreement with the previous results from Xie et al. (2025), who identified 8424 photospheric swirls utilizing Fe I 630.25 nm observations from the Swedish 1m Solar Telescope. Since our observations were made in a different passband, at different times, and by different instruments than those used in the previous study, we may infer that the dynamics of swirls in the photosphere is statistically robust.
In Sect. 3.1 we showed that intergranular lanes tend to expand at the footpoint of Hα jets, and here we show that swirls in the region with Hα jets are more likely to be expanding. One might ask whether these two observational results have any connection. Fig. 6 displays an example of the relationship among swirls, dynamics of intergranular lanes, and an Hα jet. In Figs. 6a0–a3, we show the lifecycle of an Hα jet, illustrating its appearance and dissipation. It is evident that the Hα jet emanates from a distinct intergranular lane – marked with a yellow rectangle in Figs. 6b0–b3, which is then zoomed-in on in Figs. 6c0–c3. The presence of a photospheric swirl is indicated by blue lines in panel c1, and the intergranular lanes are shown as green contours in Figs. 6c0–c3. When the Hα jet is present (Fig. 6a1), the intergranular lane expands from 0.168 Mm2 to 0.244 Mm2. When the Hα jet vanishes (Fig. 6a3), the intergranular lane contracts to 0.087 Mm2. Coincidentally, a swirl occurs in the footpoint of the jet at its observed time (Fig. 6c1). The swirl has a diameter of about 665 km, and it appears to connect a granular cell with the expanding intergranular lane. It exhibits expanding behavior with an expansion speed of 0.22 km s−1. The swirl rotates clockwise with a rotation speed of 1.2 km s−1. It is possible that the evolution of the swirl may strongly influence the dynamics of granules, potentially breaking up a granular cell into small granules and enlarging the intergranular lane. Lemmerer et al. (2017) found that strong horizontal and vertical motions have tend to be located in the vicinity of small granules. These strong motions might result in magnetic reconnection, further exciting the Hα jet.
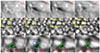 |
Fig. 6. Case showing the relations among swirls, dynamics of intergranular lanes, and an Hα jet. Panels a0–a3: Lifecycle of an Hα jet. Panels b0–b3: Evolution of the underlying photospheric granules. The footpoint of the jet is marked by a yellow rectangle. Panels c0–c3: zoom-in on the footpoint in panels b0–b3. The contour lines in green outline the area of the intergranular lane, and the blue line marks a swirl detected by the ASDA. |
Despite the presence of a considerable number of contracting swirls at the locations where Hα jets appear, considering the shorter lifetimes of swirls (Liu et al. 2019b) and Hα jets (Qi et al. 2022), it remains challenging to definitively establish a one-to-one relationship among Hα jets, dynamics of intergranular lanes, and swirls. Moreover, an Hα jet may still be associated with more than one swirl. In the future, we could choose the Hα −1.2 Å to more precisely identify the bases of chromospheric jets, and then statistically analyze the horizontal velocities of granules at the bases of these Hα jets. Moreover, we can further investigate the relationship between Hα jets and swirls, for example by determining whether Hα jets occur inside the swirls or along their boundaries, to discuss the possible formation of Hα jets. Using multiple wings of the Hα passbands, we can get more information on Hα jets and thereby discuss in greater detail how swirls differ among Hα jets with distinct characteristics.
Based on the present observations, we can conclude that intergranular lanes at the footpoints of Hα jets are mostly expanding and swirls occurring in the region rich in Hα jets are more likely to be expanding than contracting.
4. Conclusion
In this paper, we analyzed high-resolution data observed in the TiO and Hα passbands using NVST. We investigated the evolution of granules and intergranular lanes in conjunction with the ascent of 85 Hα jets. In particular, the relationships among horizontal velocities in the photosphere, area of intergranular lanes, and photospheric swirls were studied.
The photospheric horizontal velocities were derived from the TiO data using FLCT. We find that the horizontal velocities of the granules in the vicinity of these Hα jet bases during their appearances average 1.50 ± 0.64 km s−1, which is 25% higher than the general average. This higher velocity may facilitate the advection of small-scale magnetic elements, propelling them toward the network lanes and potentially triggering magnetic reconnection events, thereby energizing these Hα jets. Particularly, we observed a set of recurrent Hα jets. We find clear evidence that the photospheric horizontal velocities in the footpoints of the jet increase, while a jet emerges. We also find that the areas of intergranular lanes at the footpoints of almost all these Hα jets are expanding at their bases. The distribution of the expanding rates of intergranular lanes of these 85 Hα jets peaks at about 50% and can reach up to 300%.
By applying ASDA on the TiO data, we identified a total of 1431 swirls in the field of view during the observing period, of which 291 occur in the regions where Hα jets are present, and 1140 occur in the region devoid of Hα jets. The birthrate of swirls for the region rich in Hα jets is 2.0 × 10⁻⁵ Mm−2 s−1, and that for the rest is 1.4 × 10⁻⁵ Mm−2 s−1. The birthrate of swirls in the Hα jet region is significantly greater than that of the rest of the field of view.
We also conducted a statistical analysis of the parameters of these swirls, including rotational speeds, expansion and contraction speeds, and radii. In the region abundant in Hα jets, we find that 55.3% of the swirls rotate counterclockwise with an average speed of 1.00 km s−1, while the remaining 44.7% rotate clockwise with an average speed of −1.01 km s−1. Moreover, 61.2% of swirls expand with an average speed of ∼0.19 km s−1, whereas 38.8% contract with an average contraction speed of ∼0.18 km s−1. In the rest of the field of view, 52.3% of the swirls rotate counterclockwise with an average speed of 1.05 km s−1, while 48.7% rotate clockwise with an average speed of −1.03 km s−1. Moreover, 47.5% of swirls expand with an average expansion speed of 0.19 km s−1, while 52.5% of swirls contract with an average contraction speed of 0.20 km s−1. These results indicate no significant difference in the rotational, expanding and contracting dynamics of these two groups of swirls. Nevertheless, it is evident that swirls in regions with a high density of Hα jets exhibit a greater prevalence of expansion compared to those in other areas in the field of view.
The distributions of the radii of swirls in the two regions are almost identical. The radii of these swirls range from 150 to 550 km, with an average radius of 274.0 ± 60.8 km. The parameters of the swirls identified here are well in agreement with previous results (Xie et al. 2025), which may indicate that the dynamics of swirls in the photosphere are statistically robust.
We identified a case showing a possible link among an Hα jet, a swirl, and the expansion of an intergranular lane. In this case, the appearance of the Hα jet is apparently associated with the occurrence and rotation of a swirl and the expansion of the intergranular lane; the disappearance of the jet is accompanied by the contraction of the intergranular lane. However, such a case is not common, and it remains a challenge to definitively establish a one-to-one relationship among Hα jets, the dynamics of intergranular lanes, and swirls. Moreover, an Hα jet may be associated with more than one swirl.
To conclude, our statistical analyses indicate a physical connection among high photospheric horizontal velocities, the expansion of intergranular lanes, and photospheric swirls. We suggest a possible scenario in which photospheric dynamics power jets in the chromosphere. In this scenario, higher horizontal velocities sweep smaller magnetic elements into network lanes, leading to stronger magnetic activities, such as magnetic cancellation or reconnection, that drive Hα jets in the chromosphere. The expansion of intergranular lanes and photospheric swirls could result from material submergence associated with magnetic cancellation.
Data availability
Movie associated to Fig. 1 is available at https://www.aanda.org
Acknowledgments
We thank the NVST team for their hospitality while carrying out the observational campaign. This work is supported by the National Natural Science Foundation of China (Nos. 42230203, 42174201, 12473058), the National Key R&D Program of China (2021YFA0718600) and the Shandong Province Natural Science Foundation (ZR2023QD14). Z.H. thanks ISSI-bern for supporting the team of “Small-scale magnetic flux ropes under the microscope with Parker Solar Probe and Solar Orbiter”. Q.X. and J.L. acknowledge the support from the Strategic Priority Research Program of the Chinese Academy of Science (Grant No. XDB0560000) and the National Natural Science Foundation (NSFC 42188101, 12373056). B.Y. acknowledges the support from the National Science Foundation of China (12273106) and the CAS “Light of West China” Program. M.G. acknowledges the support from the National Natural Science Foundation of China (12203030), the Taishan Scholars Program Special Fund (tsqn202408051) and the Shandong Provincial Natural Science Foundation for Excellent Young Scientists Program (Overseas) via grant 2025HWYQ-019.
References
- Abramenko, V. I., Yurchyshyn, V. B., Goode, P. R., Kitiashvili, I. N., & Kosovichev, A. G. 2012, ApJ, 756, L27 [NASA ADS] [CrossRef] [Google Scholar]
- Attie, R., Innes, D. E., & Potts, H. E. 2009, A&A, 493, L13 [NASA ADS] [CrossRef] [EDP Sciences] [Google Scholar]
- Bellot Rubio, L., & Orozco Suárez, D. 2019, Liv. Rev. Sol. Phys., 16, 1 [Google Scholar]
- Bonet, J. A., Márquez, I., Sánchez Almeida, J., Cabello, I., & Domingo, V. 2008, ApJ, 687, L131 [Google Scholar]
- De Pontieu, B., Hansteen, V. H., Rouppe van der Voort, L., van Noort, M., & Carlsson, M. 2007, ApJ, 655, 624 [Google Scholar]
- de Pontieu, B., McIntosh, S., Hansteen, V. H., et al. 2007a, PASJ, 59, S655 [NASA ADS] [CrossRef] [Google Scholar]
- de Pontieu, B., Hansteen, V. H., Rouppe van der Voort, L., van Noort, M., & Carlsson, M. 2007b, ASP Conf. Ser., 368, 65 [Google Scholar]
- De Pontieu, B., Carlsson, M., Rouppe van der Voort, L. H. M., et al. 2012, ApJ, 752, L12 [Google Scholar]
- de Wijn, A. G., Lites, B. W., Berger, T. E., et al. 2008, ApJ, 684, 1469 [NASA ADS] [CrossRef] [Google Scholar]
- Ding, J. Y., Madjarska, M. S., Doyle, J. G., et al. 2011, A&A, 535, A95 [NASA ADS] [CrossRef] [EDP Sciences] [Google Scholar]
- Fisher, G. H., & Welsch, B. T. 2008, ASP Conf. Ser., 383, 373 [NASA ADS] [Google Scholar]
- Goode, P. R., Yurchyshyn, V., Cao, W., et al. 2010, ApJ, 714, L31 [Google Scholar]
- Graftieaux, L., Michard, M., & Grosjean, N. 2001, Meas. Sci. Technol., 12, 1422 [CrossRef] [Google Scholar]
- Hansteen, V. H., De Pontieu, B., Rouppe van der Voort, L., van Noort, M., & Carlsson, M. 2006, ApJ, 647, L73 [Google Scholar]
- Hashim, P., Hong, Z.-X., Ji, H.-S., et al. 2021, RAA, 21, 105 [NASA ADS] [Google Scholar]
- Hollweg, J. V. 1982, ApJ, 257, 345 [NASA ADS] [CrossRef] [Google Scholar]
- Hong, Z., Wang, Y., & Ji, H. 2022, ApJ, 928, 153 [NASA ADS] [CrossRef] [Google Scholar]
- Huang, Z., Madjarska, M. S., Scullion, E. M., et al. 2017, MNRAS, 464, 1753 [NASA ADS] [CrossRef] [Google Scholar]
- Iijima, H., & Yokoyama, T. 2017, ApJ, 848, 38 [NASA ADS] [CrossRef] [Google Scholar]
- Jess, D. B., Mathioudakis, M., Erdélyi, R., et al. 2009, Science, 323, 1582 [Google Scholar]
- Jess, D. B., Morton, R. J., Verth, G., et al. 2015, Space Sci. Rev., 190, 103 [Google Scholar]
- Ji, H., Cao, W., & Goode, P. R. 2012, ApJ, 750, L25 [NASA ADS] [CrossRef] [Google Scholar]
- Kuridze, D., Zaqarashvili, T. V., Henriques, V., et al. 2016, ApJ, 830, 133 [Google Scholar]
- Lemmerer, B., Hanslmeier, A., Muthsam, H., & Piantschitsch, I. 2017, A&A, 598, A126 [NASA ADS] [CrossRef] [EDP Sciences] [Google Scholar]
- Liu, Z., Xu, J., Gu, B.-Z., et al. 2014, RAA, 14, 705 [Google Scholar]
- Liu, J., Nelson, C. J., Snow, B., Wang, Y., & Erdélyi, R. 2019a, Nat. Commun., 10, 3504 [Google Scholar]
- Liu, J., Nelson, C. J., & Erdélyi, R. 2019b, ApJ, 872, 22 [Google Scholar]
- Manso Sainz, R., Martínez González, M. J., & Asensio Ramos, A. 2011, A&A, 531, L9 [NASA ADS] [CrossRef] [EDP Sciences] [Google Scholar]
- Martínez González, M. J., & Bellot Rubio, L. R. 2009, ApJ, 700, 1391 [CrossRef] [Google Scholar]
- Martínez-Sykora, J., De Pontieu, B., Carlsson, M., et al. 2017, ApJ, 847, 36 [Google Scholar]
- Morton, R. J., Tomczyk, S., & Pinto, R. 2015, Nat. Commun., 6, 7813 [Google Scholar]
- Park, S. H., Tsiropoula, G., Kontogiannis, I., et al. 2016, A&A, 586, A25 [NASA ADS] [CrossRef] [EDP Sciences] [Google Scholar]
- Qi, Y., Huang, Z., Xia, L., et al. 2019, Sol. Phys., 294, 92 [NASA ADS] [CrossRef] [Google Scholar]
- Qi, Y., Huang, Z., Xia, L., et al. 2022, A&A, 657, A118 [NASA ADS] [CrossRef] [EDP Sciences] [Google Scholar]
- Rouppe van der Voort, L. H. M., De Pontieu, B., Hansteen, V. H., Carlsson, M., & van Noort, M. 2007, ApJ, 660, L169 [Google Scholar]
- Samanta, T., Tian, H., Yurchyshyn, V., et al. 2019, Science, 366, 890 [NASA ADS] [CrossRef] [Google Scholar]
- Snow, B., Fedun, V., Gent, F. A., Verth, G., & Erdélyi, R. 2018, ApJ, 857, 125 [NASA ADS] [CrossRef] [Google Scholar]
- Tziotziou, K., Scullion, E., Shelyag, S., et al. 2023, Space Sci. Rev., 219, 1 [NASA ADS] [CrossRef] [Google Scholar]
- Wang, Y., Noyes, R. W., Tarbell, T. D., & Title, A. M. 1995, ApJ, 447, 419 [NASA ADS] [CrossRef] [Google Scholar]
- Wang, Y., Zhang, Q., & Ji, H. 2021, ApJ, 913, 59 [NASA ADS] [CrossRef] [Google Scholar]
- Weigelt, G. P. 1977, Opt. Commun., 21, 55 [NASA ADS] [CrossRef] [Google Scholar]
- Xiang, Y.-Y., Liu, Z., & Jin, Z.-Y. 2016, New Astron., 49, 8 [CrossRef] [Google Scholar]
- Xie, Q., Liu, J., Nelson, C. J., Erdélyi, R., & Wang, Y. 2025, ApJ, 979, 27 [Google Scholar]
- Yadav, N., Cameron, R. H., & Solanki, S. K. 2020, ApJ, 894, L17 [Google Scholar]
- Yadav, N., Cameron, R. H., & Solanki, S. K. 2021, A&A, 645, A3 [NASA ADS] [CrossRef] [EDP Sciences] [Google Scholar]
- Yang, Y.-F., Qu, H.-X., Ji, K.-F., et al. 2015, RAA, 15, 569 [Google Scholar]
- Yurchyshyn, V. B., Goode, P. R., Abramenko, V. I., & Steiner, O. 2011, ApJ, 736, L35 [Google Scholar]
- Zeng, Z., Cao, W., & Ji, H. 2013, ApJ, 769, L33 [NASA ADS] [CrossRef] [Google Scholar]
- Zhang, J., Yang, S.-H., & Jin, C.-L. 2009, RAA, 9, 921 [NASA ADS] [Google Scholar]
- Zhang, C., Huang, Z., Li, B., et al. 2024, Sol. Phys., 299, 53 [Google Scholar]
All Tables
All Figures
|
Fig. 1. Context images for regions studied in the present work, taken on November 1, 2022. Panel a: Continuum intensity map in the TiO passband. Panel b: Same region in the composite image of Hα +0.8 Å (blue) and Hα −0.8 Å (pink). The Hα jet enclosed by the white box is a recurrent example, presented in detail in Fig. 3. Panel c: Average horizontal velocity field during the observation period estimated by FLCT. Panel d: Composite image of the Hα −0.8 Å image (red) and the TiO 7058 Å image (green) at 12:19:31 UT. An animated version of this figure is available online. |
| In the text | |
|
Fig. 2. Panel a: Statistics of photospheric horizontal velocities at the footpoints of 85 identified Hα jets near their times of appearance. The dashed yellow line indicates the average velocity of the entire field of view over observation period. Panel b: Statistics of variations in the areas of intergranular lanes at the footpoints of the Hα jets. |
| In the text | |
|
Fig. 3. Panels a–f: Six recurrent Hα jets (dark features indicated by yellow arrows) observed between 06:12 UT and 06:46 UT. The bottom panel shows the variations in horizontal velocities at the footpoints of the recurrent jets, with dashed red lines marking the times when an Hα jet appears. The dashed green line denotes the average velocity level across the field of view. |
| In the text | |
|
Fig. 4. Detected swirls. The background represents the photospheric intensity. Red arrows indicate the horizontal velocity field estimated by FLCT. Green (blue) lines denote the edges of the detected swirls with counterclockwise (clockwise) rotations. |
| In the text | |
|
Fig. 5. Panel a: Locations of all photospheric swirls on an Hα image (plus symbols). Red pluses represent swirls in the region abundant in Hα jets and light blue pluses represent swirls in the rest of the field of view. Panels b and c: Pie charts of the proportions of expanding and contracting swirls in the two regions. |
| In the text | |
|
Fig. 6. Case showing the relations among swirls, dynamics of intergranular lanes, and an Hα jet. Panels a0–a3: Lifecycle of an Hα jet. Panels b0–b3: Evolution of the underlying photospheric granules. The footpoint of the jet is marked by a yellow rectangle. Panels c0–c3: zoom-in on the footpoint in panels b0–b3. The contour lines in green outline the area of the intergranular lane, and the blue line marks a swirl detected by the ASDA. |
| In the text | |
Current usage metrics show cumulative count of Article Views (full-text article views including HTML views, PDF and ePub downloads, according to the available data) and Abstracts Views on Vision4Press platform.
Data correspond to usage on the plateform after 2015. The current usage metrics is available 48-96 hours after online publication and is updated daily on week days.
Initial download of the metrics may take a while.