Fig. 2.
Download original image
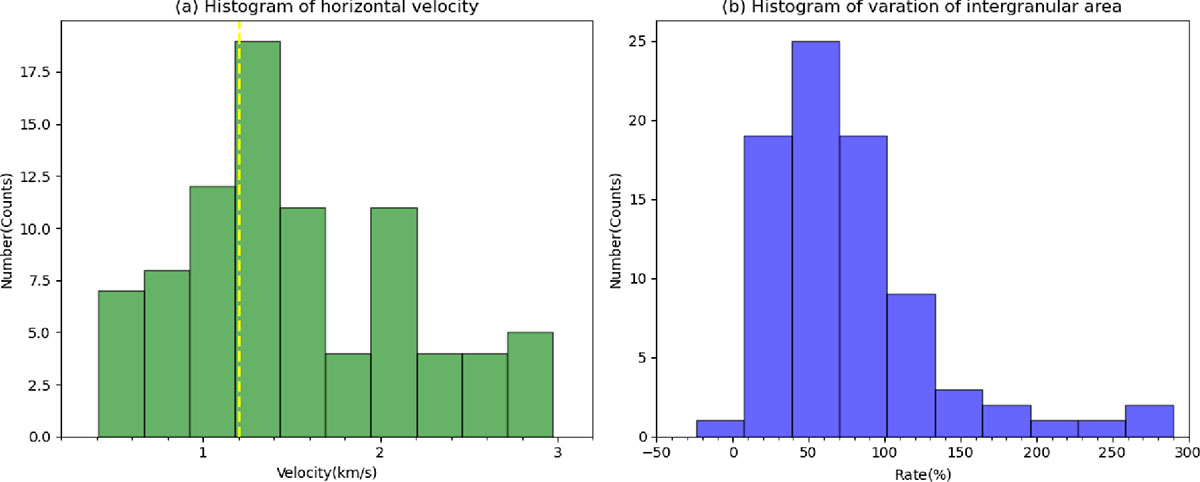
Panel a: Statistics of photospheric horizontal velocities at the footpoints of 85 identified Hα jets near their times of appearance. The dashed yellow line indicates the average velocity of the entire field of view over observation period. Panel b: Statistics of variations in the areas of intergranular lanes at the footpoints of the Hα jets.
Current usage metrics show cumulative count of Article Views (full-text article views including HTML views, PDF and ePub downloads, according to the available data) and Abstracts Views on Vision4Press platform.
Data correspond to usage on the plateform after 2015. The current usage metrics is available 48-96 hours after online publication and is updated daily on week days.
Initial download of the metrics may take a while.