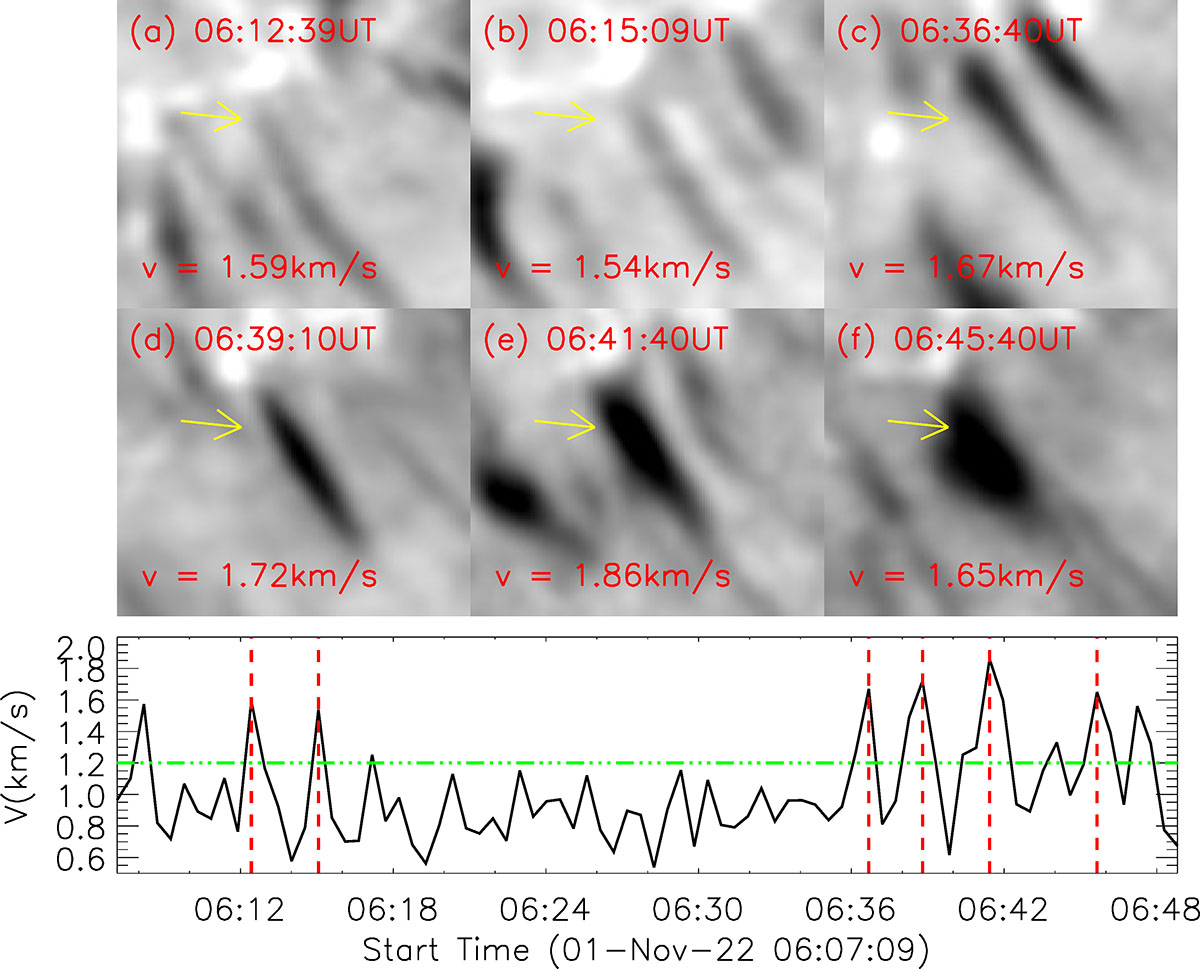
Fig. 3.
Download original image
Panels a–f: Six recurrent Hα jets (dark features indicated by yellow arrows) observed between 06:12 UT and 06:46 UT. The bottom panel shows the variations in horizontal velocities at the footpoints of the recurrent jets, with dashed red lines marking the times when an Hα jet appears. The dashed green line denotes the average velocity level across the field of view.
Current usage metrics show cumulative count of Article Views (full-text article views including HTML views, PDF and ePub downloads, according to the available data) and Abstracts Views on Vision4Press platform.
Data correspond to usage on the plateform after 2015. The current usage metrics is available 48-96 hours after online publication and is updated daily on week days.
Initial download of the metrics may take a while.