Fig. 12
Download original image
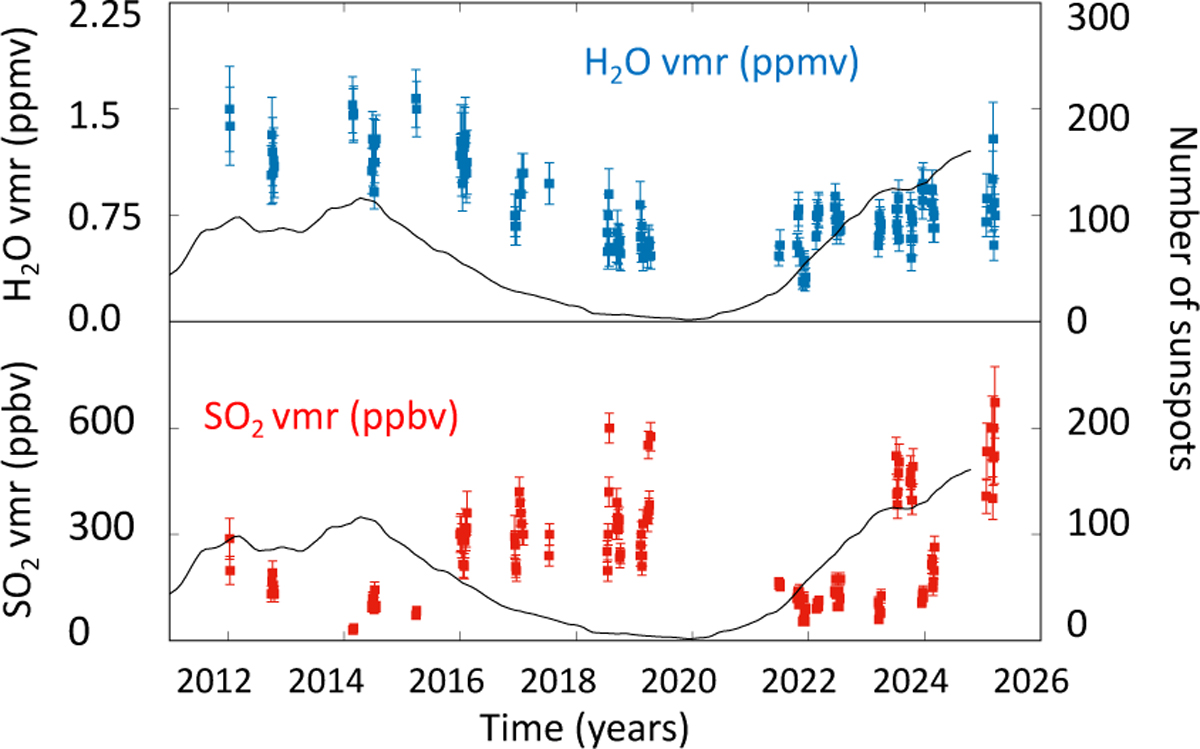
Top: long-term variations in the disk-integrated H2O volume mixing ratio (blue points), inferred from the HDO measurements at the cloud top from the TEXES data at 7.4 µm. Bottom: long-term variations in the disk-integrated SO2 volume mixing ratio inferred at the cloud top (7.4 µm, red points). A daily value is shown in this figure. The error bars represent the uncertainty in the disk-integrated HDO and SO2 volume mixing ratios, averaged over a day. They depend upon the quality of the terrestrial atmospheric transparency, the size of the planetary disk, the continuum level and the number of maps recorded each day. In both cases, the solar activity (measured by the sunspot number) is shown for comparison.
Current usage metrics show cumulative count of Article Views (full-text article views including HTML views, PDF and ePub downloads, according to the available data) and Abstracts Views on Vision4Press platform.
Data correspond to usage on the plateform after 2015. The current usage metrics is available 48-96 hours after online publication and is updated daily on week days.
Initial download of the metrics may take a while.