Open Access
Fig. 14
Download original image
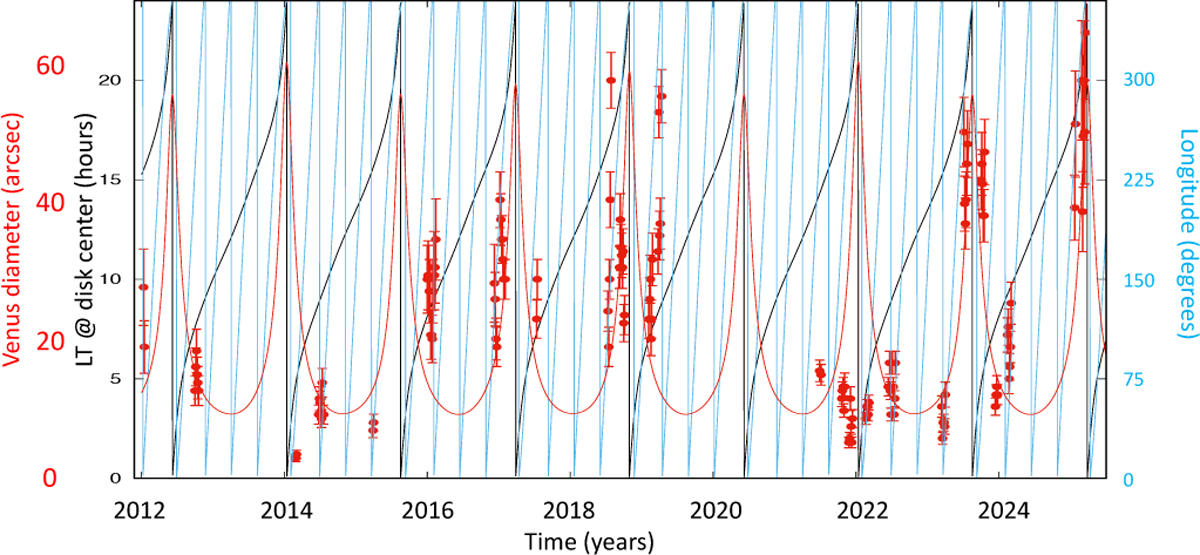
Long-term variations in the SO2 volume mixing ratio measured by TEXES at the cloud top between 2012 and 2025 (red points). The Venus diameter (red line), the local time at the disk center (black line) and the longitude at the disk center (blue line) are shown for comparison.
Current usage metrics show cumulative count of Article Views (full-text article views including HTML views, PDF and ePub downloads, according to the available data) and Abstracts Views on Vision4Press platform.
Data correspond to usage on the plateform after 2015. The current usage metrics is available 48-96 hours after online publication and is updated daily on week days.
Initial download of the metrics may take a while.