Fig. 6
Download original image
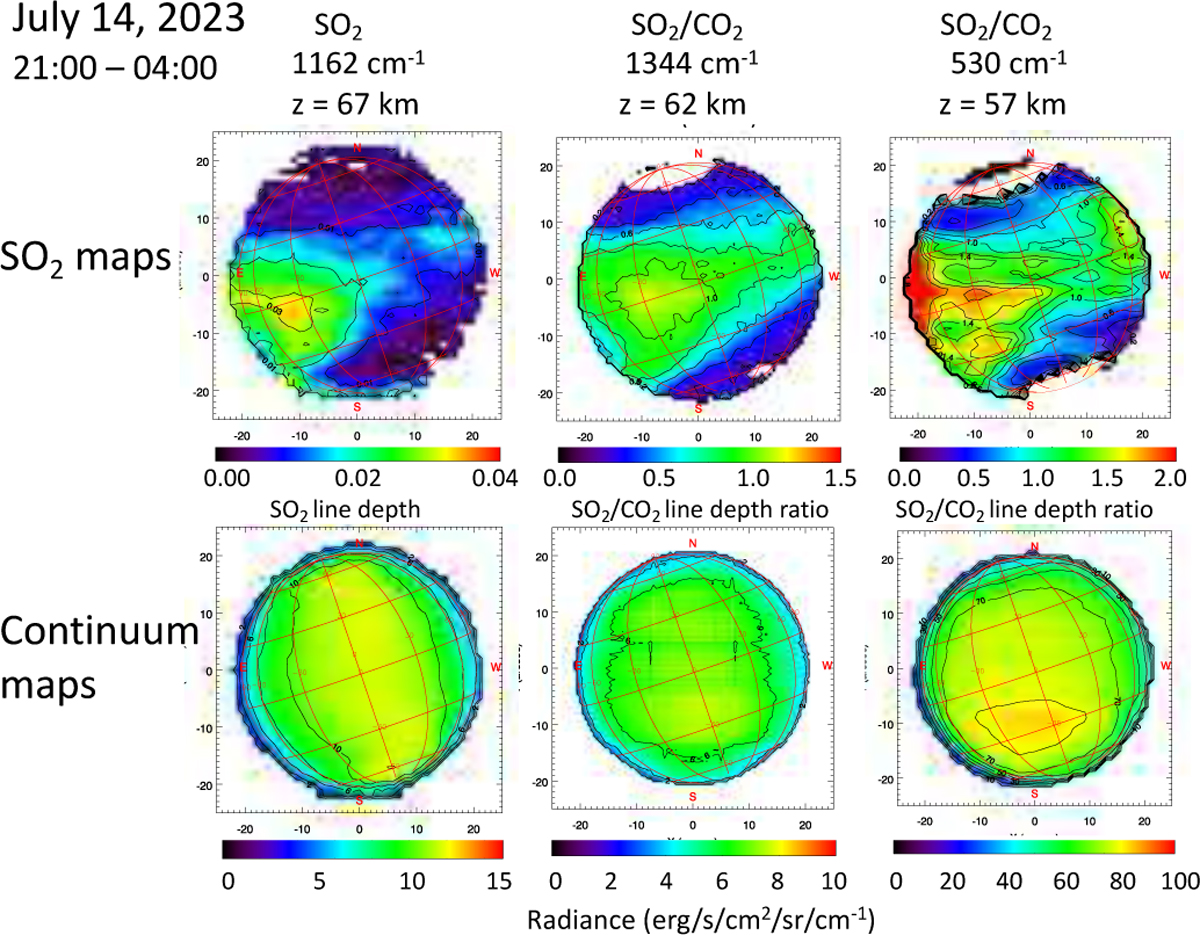
Top: SO2 maps recorded on July 14, 2023. Left: z = 67 km (SO2 line depth); middle: z = 62 km (SO2/CO2 line depth ratio); right: z = 57 km (SO2/CO2 line depth ratio). Disk-integrated spectra corresponding to these maps are shown in Figs. 3–5. Bottom: continuum maps recorded on July 14, 2023 at z = 67 km (left), 62 km (middle) and 57 km (right).
Current usage metrics show cumulative count of Article Views (full-text article views including HTML views, PDF and ePub downloads, according to the available data) and Abstracts Views on Vision4Press platform.
Data correspond to usage on the plateform after 2015. The current usage metrics is available 48-96 hours after online publication and is updated daily on week days.
Initial download of the metrics may take a while.