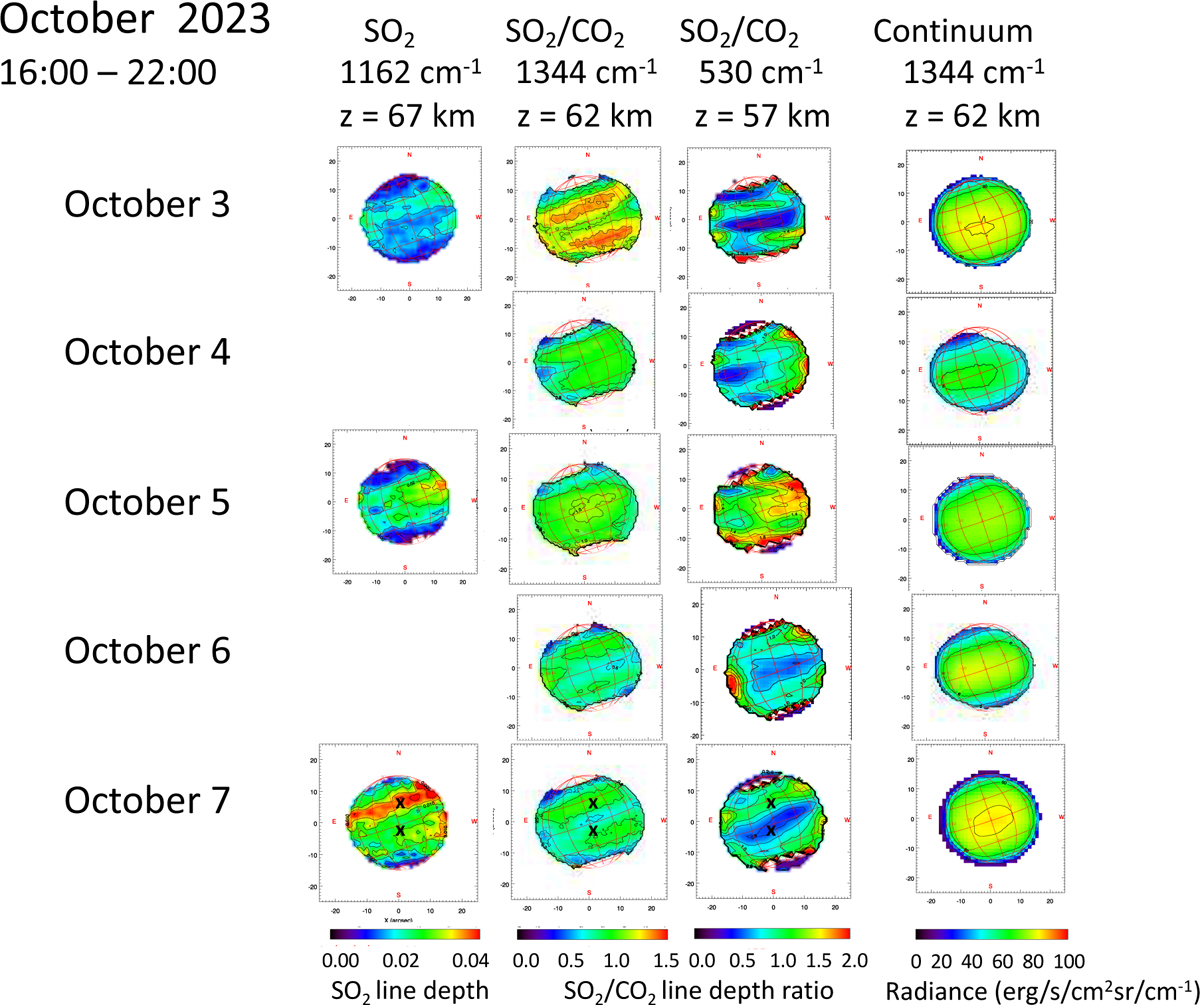
Fig. 7
Download original image
SO2 maps recorded on October 3–7, 2023. Left: z = 67 km (SO2 line depth); middle: z = 62 km (SO2/CO2 line depth ratio); next: z = 57 km (SO2/CO2 line depth ratio). Last right column: continuum maps recorded on October 3–7, 2023 at z = 62 km. The black crosses on the October 7 SO2 maps indicate the positions corresponding to the spectra shown in Figs. 9–11 (disk center and 30°N latitude).
Current usage metrics show cumulative count of Article Views (full-text article views including HTML views, PDF and ePub downloads, according to the available data) and Abstracts Views on Vision4Press platform.
Data correspond to usage on the plateform after 2015. The current usage metrics is available 48-96 hours after online publication and is updated daily on week days.
Initial download of the metrics may take a while.