Fig. 1
Download original image
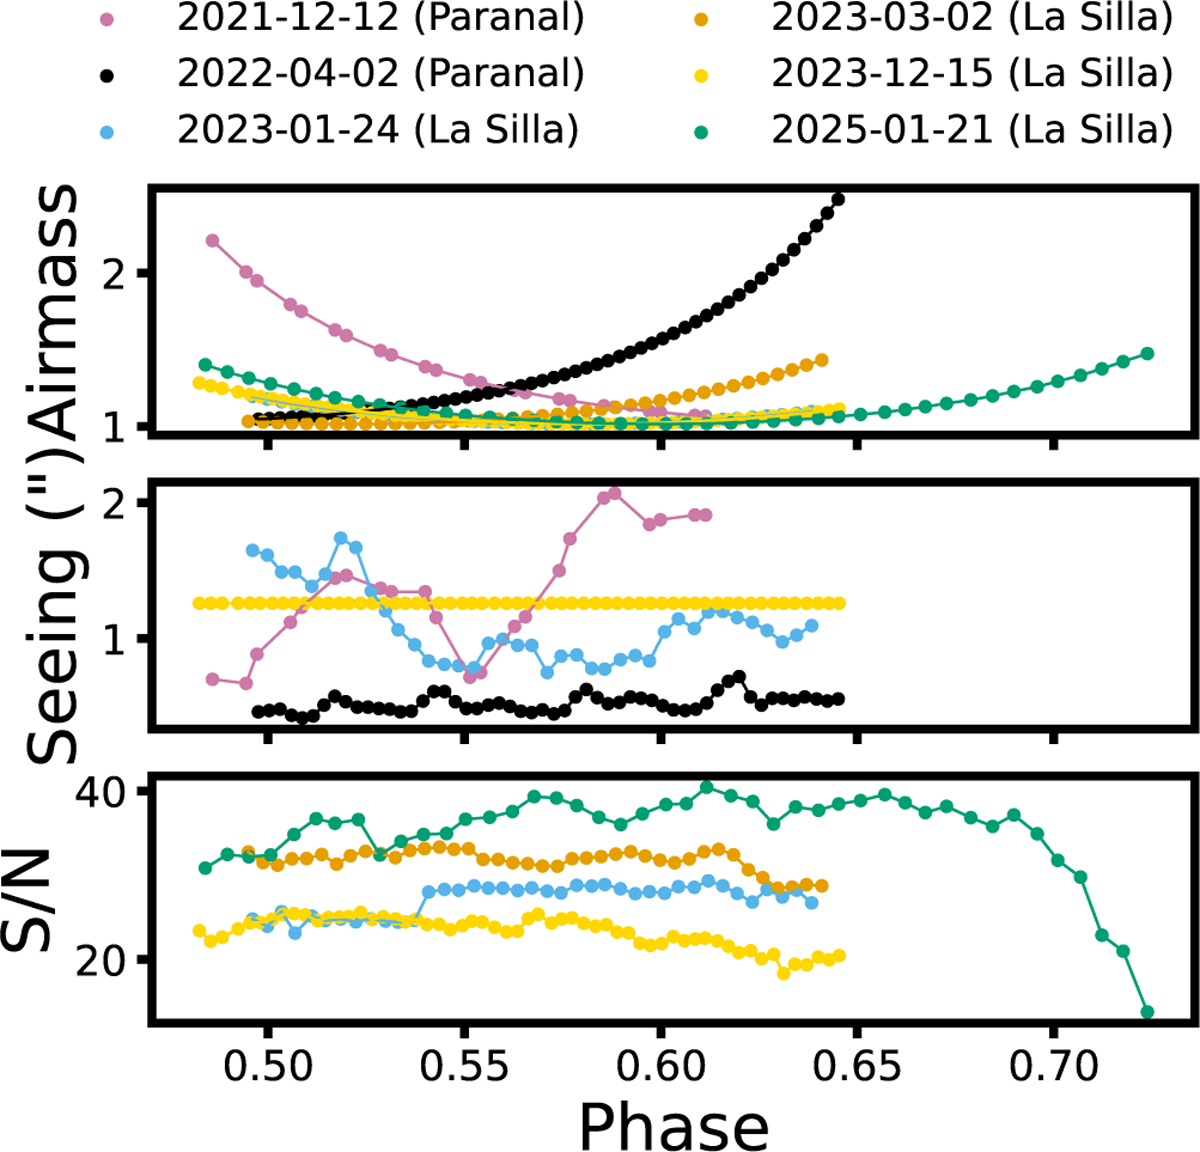
Observing conditions as a function of phase. The blue, orange, yellow, and green points correspond to NIRPS (and simultaneous HARPS) observations, while the pink and black points represent CRIRES+ observations in the H- and K-bands, respectively. Top panel and mid panel illustrate the airmass and the average atmospheric Dimm seeing (i.e. value for the differential image monitor) evolving during the nights, respectively. The Dimm seeing is averaged for each observations (i.e. average between the start and the end of each observation). The bottom panel shows the signal-to-noise ratio (extracted from the fits header) changing during the nights.
Current usage metrics show cumulative count of Article Views (full-text article views including HTML views, PDF and ePub downloads, according to the available data) and Abstracts Views on Vision4Press platform.
Data correspond to usage on the plateform after 2015. The current usage metrics is available 48-96 hours after online publication and is updated daily on week days.
Initial download of the metrics may take a while.