Fig. 10
Download original image
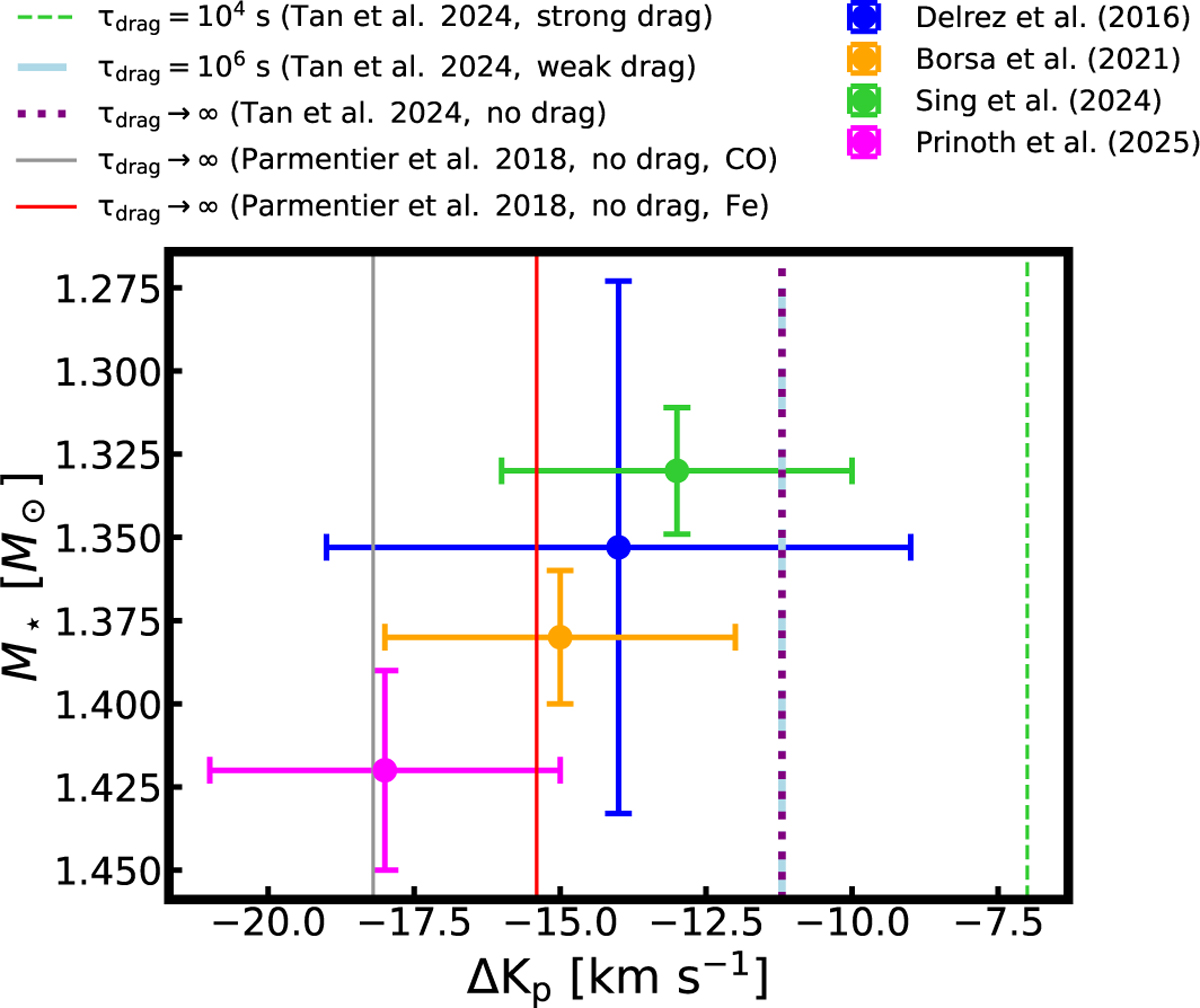
Vecolity offset, ΔKp, as a function of different stellar masses. This plot serves to visualise the Table 6 in comparison with global circulation model predictions. Each data point with uncertainties corresponds to the computed ΔKp as a function of the stellar mass (reported in Table 6) as derived by Delrez et al. (2016) (M⋆ = 1.35 ± 0.08 M⊙), Borsa et al. (2021) (M⋆ = 1.38 ± 0.02 M⊙), Sing et al. (2024) (M⋆ = 1.33 ± 0.02 M⊙), and Prinoth et al. (2025) (M⋆ = 1.42 ± 0.03 M⊙), respectively. Uncertainties are calculated via error propagation. Vertical lines mark the GCM predictions, namely models with zero, weak, and strong drag by Tan et al. (2024) and drag-free models by Parmentier et al. (2018).
Current usage metrics show cumulative count of Article Views (full-text article views including HTML views, PDF and ePub downloads, according to the available data) and Abstracts Views on Vision4Press platform.
Data correspond to usage on the plateform after 2015. The current usage metrics is available 48-96 hours after online publication and is updated daily on week days.
Initial download of the metrics may take a while.