Fig. B.1
Download original image
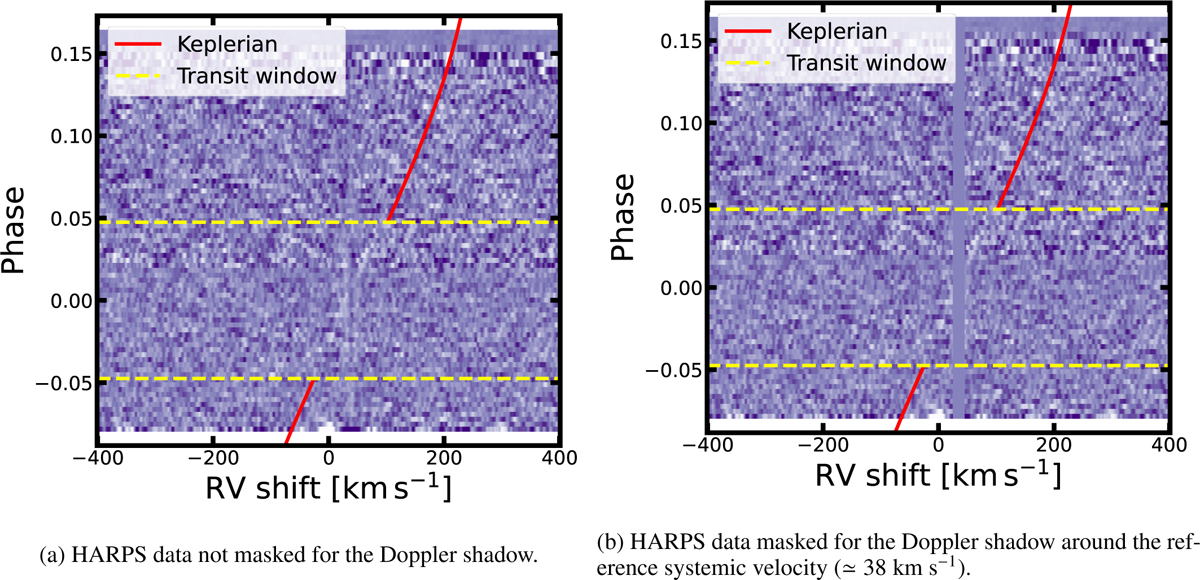
Iron cross-correlation trail maps for HARPS optical data exhibiting non-negligible stellar contamination (i.e. Rossiter-McLaughlin effect) at the systemic velocity expected from Delrez et al. (2016). Dashed yellow lines define the transit window. The solid red line illustrates the Keplerian curve (i.e. the planet’s orbital motion). Panel (a) shows the HARPS optical data not corrected for the stellar contamination as Doppler shadow, while panel (b) shows the Doppler shadow masked (corresponding flux values are set to NaN and discarded).
Current usage metrics show cumulative count of Article Views (full-text article views including HTML views, PDF and ePub downloads, according to the available data) and Abstracts Views on Vision4Press platform.
Data correspond to usage on the plateform after 2015. The current usage metrics is available 48-96 hours after online publication and is updated daily on week days.
Initial download of the metrics may take a while.