Fig. 7
Download original image
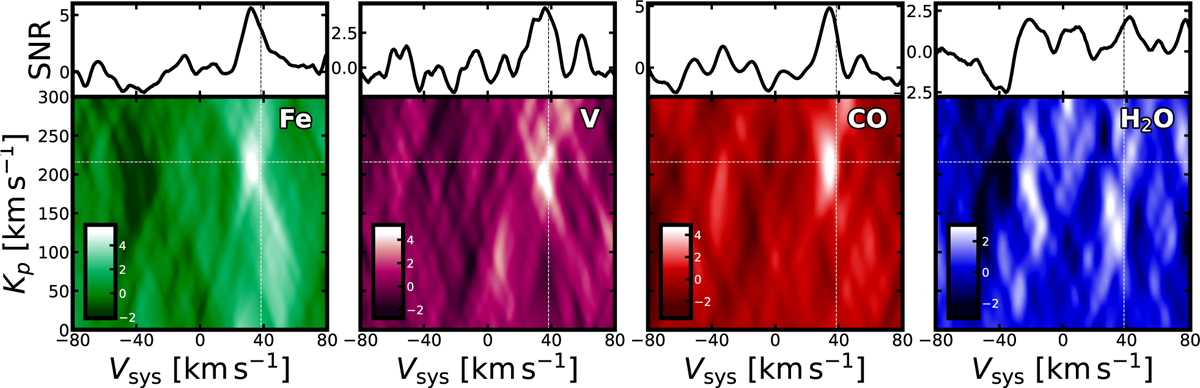
Detections of CCFs for Fe (SNR=5.8), CO (SNR=5.0), and V (SNR=4.7), and non-detection of H2O (SNR<2.0) in the transmission spectrum of WASP-121b. Each squared panel shows the two-dimensional cross-correlation map in the velocity-velocity space (Kp − Vsys). The white dashed lines indicate the expected position of the planetary signal within the velocity-velocity space, namely the expected orbital (~216 km s−1, Hoeijmakers et al. 2024) and systemic (3 8.35 ± 0.02 km s−1, Delrez et al. 2016) velocities of WASP-121b. The rectangular panels on top depicts the one-dimensional cross-correlation of each species as signal-to-noise ratio versus systemic velocity. Detections of Fe and V are primarily driven by the optical HARPS observations, while the CO detection by the infrared CRIRES+ data (mostly K-band observations).
Current usage metrics show cumulative count of Article Views (full-text article views including HTML views, PDF and ePub downloads, according to the available data) and Abstracts Views on Vision4Press platform.
Data correspond to usage on the plateform after 2015. The current usage metrics is available 48-96 hours after online publication and is updated daily on week days.
Initial download of the metrics may take a while.