Fig. 10.
Download original image
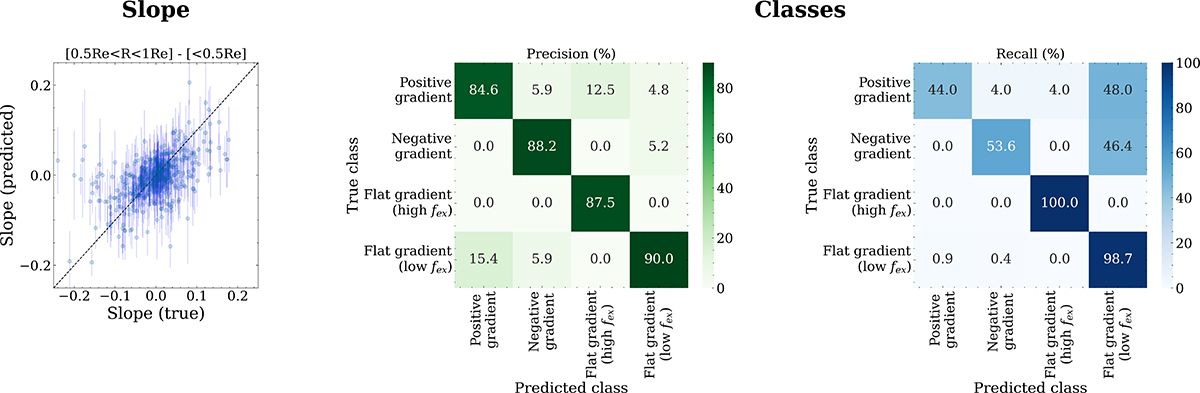
Recovery of the slope and the classes classification in the MaNGIA test set. Left: Comparison between the true and predicted slope in the MaNGIA test set. The one-to-one line is shown for reference. While the model recovers the overall trends, extreme slope values are more difficult to capture. The error bars correspond to the standard deviation of the recovered slopes from the 100 samples. Right: Confusion matrix for the classification on the same test set. Precision is high in all classes (> 84%), meaning false positives are rare. Recall is lower for the underrepresented positive and negative slope classes, which are often classified as the most common flat-slope (low ex situ) class.
Current usage metrics show cumulative count of Article Views (full-text article views including HTML views, PDF and ePub downloads, according to the available data) and Abstracts Views on Vision4Press platform.
Data correspond to usage on the plateform after 2015. The current usage metrics is available 48-96 hours after online publication and is updated daily on week days.
Initial download of the metrics may take a while.