| Issue |
A&A
Volume 703, November 2025
|
|
|---|---|---|
| Article Number | A290 | |
| Number of page(s) | 18 | |
| Section | Extragalactic astronomy | |
| DOI | https://doi.org/10.1051/0004-6361/202556260 | |
| Published online | 21 November 2025 | |
The spatially resolved effect of mergers on the stellar mass assembly of MaNGA galaxies
1
Instituto de Astrofísica de Canarias, C. Vía Láctea, 1, E-38205 La Laguna, Tenerife, Spain
2
Universidad de la Laguna, dept. Astrofísica, E-38206 La Laguna, Tenerife, Spain
3
Université Paris-Cité, LERMA – Observatoire de Paris, PSL, Paris, France
4
SCIPP, University of California, Santa Cruz, CA 95064, USA
5
Département de Physique, Université de Montréal, Succ. Centre-Ville, Montréal, Québec H3C 3J7, Canada
6
Mila–Quebec Artificial Intelligence Institute, Montreal, Québec, Canada
7
Center for Computational Astrophysics, Flatiron Institute, New York, USA
8
Department of Astrophysics, University of Vienna, Türkenschanzstrasse 17, 1180 Vienna, Austria
⋆ Corresponding author: This email address is being protected from spambots. You need JavaScript enabled to view it.
Received:
4
July
2025
Accepted:
25
September
2025
Abstract
Context. Understanding the origin of stars within a galaxy, namely whether they formed in situ or were accreted from other galaxies (ex situ), is key to constraining its evolution. When they are spatially resolved, these components provide crucial insights into the mass assembly history of a galaxy.
Aims. We predict the spatial distribution of the ex situ stellar mass fraction in MaNGA galaxies and identify distinct assembly histories based on the radial gradients of these predictions in the central regions.
Methods. We employed a diffusion model trained on mock MaNGA analogs (MaNGIA) that were derived from the cosmological simulation TNG50. The model learned to predict the posterior distribution of resolved ex situ stellar mass fraction maps that were conditioned on the stellar mass density, the velocity, and the velocity dispersion gradient maps. After validating the model on an unseen test set from MaNGIA, we applied it to MaNGA galaxies to infer the spatially resolved distribution of their ex situ stellar mass fractions, that is, on the fraction of stellar mass in each spaxel originating from mergers.
Results. We identified four broad categories of ex situ mass distributions: (1) flat gradient, in situ dominated; (2) flat gradient, ex situ dominated; (3) positive gradient; and (4) negative gradient. The vast majority of MaNGA galaxies fall in the first category. They have flat gradients with low ex situ fractions. This confirms that in situ star formation is the main assembly driver for low- to intermediate-mass galaxies. At high stellar masses ( > 1011 M⊙), the ex situ maps are more diverse. This highlights the key role of mergers in building the most massive systems. Ex situ mass distributions correlate with the morphology, the star formation activity, the stellar kinematics, and the environment. This indicates that the accretion history is a primary factor in shaping massive galaxies. Finally, by tracing their assembly histories in TNG50, we linked each class to distinct merger scenarios that ranged from secular evolution to merger-dominated growth.
Conclusions. The central gradients of the ex situ stellar mass fraction encode meaningful information about the assembly history of galaxies. Our results highlight the power of combining cosmological simulations with machine-learning to infer the unseen components of galaxies from observable properties.
Key words: methods: statistical / galaxies: evolution / galaxies: interactions
© The Authors 2025
 Open Access article, published by EDP Sciences, under the terms of the Creative Commons Attribution License (https://creativecommons.org/licenses/by/4.0), which permits unrestricted use, distribution, and reproduction in any medium, provided the original work is properly cited.
This article is published in open access under the Subscribe to Open model. This email address is being protected from spambots. You need JavaScript enabled to view it. to support open access publication.
1. Introduction
Despite the vastness of the Universe, galaxies tend to cluster in relatively small regions (Peebles 1980), and gravity can bring them close enough to merge. Galaxy mergers play a fundamental role in galaxy evolution. They serve as a primary mechanism for increasing the stellar mass and size of a galaxy (Somerville & Davé 2015). In particular for massive systems, this process is part of a two-phase formation scenario (Oser et al. 2010), in which galaxies first grow rapidly through in situ star formation at high redshift (z > 2), followed by a prolonged phase of ex situ stellar mass assembly through the accretion of stars that formed in other galaxies primarily via merger events. These mergers occur in various forms: A galaxy may absorb smaller satellite galaxies and gradually increase its stellar mass (Naab et al. 2009), or galaxies of comparable size may collide and merge through a more violent high-impact event (López-Sanjuan et al. 2012; Prieto et al. 2013; Duncan et al. 2019).
In addition to increasing the stellar mass, mergers can have a variety of pronounced effects in the evolution of a galaxy. They can trigger morphological transformations (Kormendy et al. 2009), induce inflows of gas that rejuvenate star formation (Patton et al. 2011), and fuel active galactic nuclei (AGN) activity (Ellison et al. 2008). It remains challenging to quantify how much of the stellar mass of a galaxy is built through mergers, however, because the origin of the stellar components from in situ and ex situ stars cannot be directly observed.
A series of simulation studies have helped us to establish global trends in ex situ stellar mass buildup across cosmic time. Oser et al. (2010) reported based on cosmological zoom-in simulations that the ex situ stellar mass fraction is strongly correlated with the galaxy mass, and that more massive galaxies have typically assembled a larger portion of their stars through mergers. This trend has since been confirmed with semi-analytic models (Cooper et al. 2013, 2015) and large-volume cosmological simulations (Rodriguez-Gomez et al. 2016; Nelson et al. 2019; Davison et al. 2020; Remus & Forbes 2022). These studies showed a consistent picture: The ex situ stellar mass fractions increase with galaxy stellar mass, which agrees with a hierarchical scenario of galaxy evolution. Additional trends with galaxy characteristics emerged, for instance, that accretion is more significant in the stellar mass assembly of systems with early-type morphologies and slow rotation (Rodriguez-Gomez et al. 2017; Tacchella et al. 2019). These global trends reflect the cumulative role of mergers in shaping galaxies, but they do not capture the full spatial complexity of the accreted material.
More recently, a number of studies have taken advantage of the detailed information provided by cosmological simulations to track the spatial deposition of accreted mass within galaxies. In general, these works reported that in situ stars dominate the inner regions, while accreted stars are preferentially deposited at larger radii. This leads to an average positive gradient in the radial profile of the ex situ stellar mass fraction (Rodriguez-Gomez et al. 2016; Amorisco 2017; Karademir et al. 2019; Davison et al. 2020; Boecker et al. 2023). Cosmological simulations have also revealed that the spatial distribution of accreted material strongly depends on the mass ratios and timing of the merger events. More specifically, minor and very minor mergers typically fail to reach the central regions. They instead contribute to the buildup of the stellar halo (Rodriguez-Gomez et al. 2016). This is consistent with observational constraints that identified minor mergers as the primary driver of the late-time size growth in early-type galaxies (Naab et al. 2009). In contrast, more massive satellites, which experience stronger dynamical friction, can sink deeper into the host potential. Temporal signatures are also imprinted in the radial distribution: Stars from earlier mergers are deposited at smaller radii, and stars from more recent events populate the outskirts (Amorisco 2017). This transition radius between in situ and ex situ dominance varies systematically with stellar mass, morphology, and assembly history (Rodriguez-Gomez et al. 2016; Remus & Forbes 2022).
While these simulation results are insightful, similar observational constraints remain challenging and often rely on support from theoretical models. Understanding the accreted stellar halo of the Milky Way is a central goal of Galactic archaeology. This field reconstructs the Galaxy merger history through a detailed chemodynamical analysis of halo stars (Helmi 2020). Within the Local Group, several studies have combined deep photometric mapping of the stellar structures of galaxies in the Milky Way stellar mass regime with N-body simulations of satellite accretion to estimate their accreted mass content (Harmsen et al. 2017; Smercina et al. 2022). Beyond the Local Group, more indirect methods have been applied. Approaches using decompositions of the surface brightness profile and stellar population gradients mainly from large integral field spectroscopy surveys have attempted to constrain ex situ content (Spavone et al. 2017; Huang et al. 2018; Oyarzún et al. 2019; Boecker et al. 2020; Davison et al. 2021; Cannarozzo et al. 2023). These studies often relied on simplified models or comparisons to simulations, and they typically found that accreted stars dominate at large radii in massive early-type galaxies. This is similar to the results found in large-volume simulations.
Recently, the dynamically hot inner halo has been proposed as an observational proxy for the ex situ stellar mass. Using the TNG50 simulation, Zhu et al. (2022a) demonstrated that this component traces the cumulative accreted fraction reasonably well. This framework was then applied to estimate the ex situ content in two early-type galaxies in the Fornax cluster (Zhu et al. 2022b). This approach requires computationally expensive orbital decomposition methods, however, and its application therefore remains limited so far in terms of sample size. Beyond structural tracers, observational estimates of merger rates provide another constraint on the contribution of mergers to galaxy growth (López-Sanjuan et al. 2015; Man et al. 2016; Mundy et al. 2017; Mantha et al. 2018; Puskás et al. 2025). Conselice et al. (2022) used deep near-infrared imaging from the Redshift Evolution and Formation in Extragalactic Systems (REFINE) survey to directly measure galaxy pair fractions and merger rates out to z ∼ 3. They quantified the stellar mass growth driven by major and minor mergers. This analysis was recently extended by Duan et al. (2025) using JWST data. The authors showed that mergers contribute to roughly half of the stellar mass buildup at high redshift, which reinforces their dominant role in early galaxy assembly. These results offer an independent measure of how mergers shape galaxies across mass and time.
While the majority of these works focused on retrieving global trends, a vast pool of information is encoded in the spatial distribution of the accreted stellar mass. Recent studies using the IllustrisTNG (Pulsoni et al. 2021) and Magneticum (Remus & Forbes 2022) simulations have shown that the spatial imprint of ex situ stars can be linked to the detailed merger history of galaxies. In particular, these works defined subgroups of galaxies based on the shape of their radial ex situ fraction profiles (e.g., steeply rising, flat, or declining) and connected these profile types to differences in merger histories, including the number, timing, and mass ratios of past mergers. These findings offer valuable insights into the assembly of galaxies, but it remains nontrivial to translate them into real observational constraints.
Machine-learning offers a promising avenue to bridge this gap (Margalef-Bentabol et al. 2024; Koppula et al. 2021; Ferreira et al. 2025; Pearson et al. 2024). By combining the predictive capabilities of neural networks with the detailed ground truth available in simulations, we can infer physical quantities that are otherwise inaccessible in observational data. Galaxy mergers have been widely studied with the power of machine-learning, from detecting tidal features (Walmsley et al. 2019) to identifying merging phases (Bickley et al. 2021), estimating merger rates (Ferreira et al. 2020), and probing mergers at higher redshifts (Ćiprijanović et al. 2020). In our recent work (Eisert et al. 2023; Angeloudi et al. 2023), we focused on a more challenging aspect: The retrieval of information on the past stellar mass assembly of galaxies from their observable features through a merger archaeology approach. We showed that neural networks can retrieve key merger-related parameters from simulated galaxies using realistic observational inputs. Specifically, we demonstrated that spatially resolved maps of stellar mass and kinematics from integral field unit (IFU) data can be used to predict ex situ stellar mass fractions with high accuracy across two different cosmological simulations. Other efforts using photometric data have reported similar results (Cai et al. 2025), which further highlights the potential of this approach.
Building on this foundation, our latest work trained a machine-learning model using the MaNGIA dataset (Sarmiento et al. 2023), which consists of mock analogs of galaxies from the Mapping Nearby Galaxies at Apache Point Observatory (MaNGA) survey. We then applied the trained model to real MaNGA galaxies to estimate their global ex situ stellar mass fractions (Angeloudi et al. 2024). For the first time in a statistically significant observational sample, this revealed trends between ex situ content and stellar mass, morphology, star formation, and environment. In the present study, we expand this framework by training a more advanced machine-learning model to predict 2D spatially resolved ex situ stellar mass fraction maps. These maps provide an enhanced insight into the spatial structure of the accreted component and its relation to the merger history of each galaxy. Our method provides a robust pathway toward understanding the role of mergers in galaxy evolution, in particular, to disentangle the contributions of in situ and ex situ processes.
The paper is structured as follows. In Section 2 we introduce the observational (MaNGA) and the synthetic dataset (MaNGIA), which was forward-modeled to match the observational realism of MaNGA and was used to train a machine-learning model that inferred 2D spatially resolved maps of the ex situ stellar mass fraction. Section 3 details the creation of ground-truth maps from simulations and the architecture of the diffusion model. In Section 4 we validate the method on mock test data. In Section 5 we proceed by applying the diffusion model to the MaNGA galaxy sample by generating ex situ fraction maps for over 10 000 galaxies that we analyzed via their radial profiles. We classified them into four groups based on the central gradients. In Section 6 we link these groups to distinct merger histories using TNG50 and propose four distinct evolutionary scenarios. We summarize our conclusions in Section 7.
2. Datasets
2.1. MaNGA
MaNGA (Bundy et al. 2015) is the integral field spectroscopic component of SDSS-IV, designed to spatially map the kinematic and spectroscopic properties of over 10 000 nearby galaxies. The sample spans stellar masses from 109 M⊙ to 1012 M⊙ and redshifts between 0.01 < z < 0.15 (median z ∼ 0.03), with spectral coverage from 3600–10 300 Å at a resolution of R ∼ 2000. Each galaxy is observed using a fiber bundle with diameters ranging from 12″ (19 fibers) to 32″ (127 fibers), depending on the target size. The full sample is divided into three subsamples: the primary sample (covering out to 1.5Re, 50% of targets), the secondary sample (up to 2.5Re, ∼33% of the targets), and the color-enhanced sample (∼17%), which supplements underpopulated regions in the NUV–i versus Mi color–magnitude plane (Wake et al. 2017). Stellar mass estimates were taken from the NSA (NASA-Sloan Atlas) catalog, based on K-corrected elliptical Petrosian fluxes. To ensure consistency with the simulations, we corrected these masses to reflect the Planck 2015 cosmology (Planck Collaboration XIII 2016), adjusting from the NSA h = 1 to h = 0.6774 using Mcorr⋆ = M⋆ − 5log10(h)/2.5. We also used various premeasured properties from the MaNGA survey as listed below.
-
Morphological classification: Galaxies are categorized into three types (elliptical, S0, and spiral) using the MaNGA PyMorph morphological catalog (Domínguez Sánchez et al. 2022). We identify 2460 elliptical, 923 S0 and 5311 spiral galaxies in the MaNGA sample.
-
Star formation activity: We classify galaxies as star-forming or quenched using the integrated star formation rate (SFR) from the Ha emission line, as derived from the PIPE3D analysis (Sánchez et al. 2016). The separation is made on the SFR versus stellar mass plane, resulting in 5724 star-forming and 4519 quenched galaxies.
-
Rotation and angular momentum: Galaxies are classified as slow or fast rotators using the λRe angular momentum proxy and ellipticity ϵ, based on the criterion proposed by Cappellari (2016) and data from Graham et al. (2018). We identify 964 slow rotators and 9279 fast rotators.
-
Halo mass: We use halo mass estimates from the self-calibrating halo-based group catalog (Tinker 2021). We identify 3038 galaxies in halos with Mhalo > 1013 M⊙, 2616 galaxies in the range 1012 M⊙ < Mhalo < 1013 M⊙, and 4589 galaxies in halos with Mhalo < 1012 M⊙.
-
Environment: We use the environment classification provided by the MaNGA GEMA-VAC. Using the classification scheme provided, we identify 2905 galaxies residing in clusters, 3793 in filaments, 989 in sheets and 140 in voids.
2.2. MaNGIA
We used MaNGIA (Sarmiento et al. 2023) as our training set. MaNGIA is a forward-modeled dataset based on the TNG50 simulation (Pillepich et al. 2019; Nelson et al. 2019), which represents the highest-resolution run within the IllustrisTNG suite. Galaxies are selected from TNG50 to match the stellar mass, size, and redshift distribution of the MaNGA survey and are forward-modeled to resemble realistic MaNGA-like integral field datacubes. This process includes synthetic spectral generation, emulation of the MaNGA fibre bundle geometry, and incorporation of observational effects such as seeing and instrumental noise. The final datacubes are processed with the PIPE3D pipeline (Sánchez et al. 2022; Lacerda et al. 2022), enabling a consistent analysis of stellar populations and kinematics. Since PIPE3D is also used in the official MaNGA data releases, it allows for direct comparison between mock and observed galaxies. The MaNGIA dataset accurately reproduces key observed trends in galaxy properties, including metallicity gradients, stellar age distributions, and velocity fields, making it well-suited for data-driven studies. In addition to the publicly released sample, we expand our training dataset with an extended set of ∼1600 simulated galaxies generated through the same method, not yet incorporated in the public dataset.
3. Methods
3.1. Creating 2D ex situ maps
The goal of this work is to train a machine-learning model capable of predicting the 2D distribution of ex situ stellar mass fraction of galaxies from their spatially resolved observables, specifically stellar mass and kinematics maps. We adopt a supervised learning approach, where the target ground-truth data are derived from large-volume cosmological simulations.
Since MaNGIA is based on galaxies from the TNG50 run of the IllustrisTNG simulation suite, we used the particle-level information of the simulation to define the ex situ stellar mass. Following the definition in Rodriguez-Gomez et al. (2016), stellar particles are classified as in situ if they formed within the main progenitor branch of the galaxy they currently belong to, and as ex situ if they formed outside of it. This classification has already been applied to all stellar particles in TNG50 and is available through the stellar assembly catalogs (Rodriguez-Gomez et al. 2016), making MaNGIA a unique dataset for exploring the spatial imprint of galaxy accretionhistories.
For each MaNGIA galaxy, we extract the stellar particles within the field of view used for the original forward-modeling and apply the same projection. Using a 2D grid, we spatially bin the stellar particles, summing the stellar masses of stars within each bin (separating per origin) to create resolved maps of the ex situ and in situ stellar mass distributions. The ex situ stellar mass fraction map is then obtained by dividing the ex situ mass map by the sum of the ex situ and in situ mass maps in each bin. Then, these resolved ex situ stellar mass fraction maps serve as the training targets for our machine-learning model.
3.2. Diffusion models
In our previous work (Angeloudi et al. 2024), we demonstrated the use of simulation-based inference to predict the global ex situ stellar mass fraction of MaNGA galaxies from IFU-like data. That study employed a simple convolutional neural network (CNN), enhanced with self-supervised techniques to improve generalization. In the present work, we build upon that approach by extending the prediction task to 2D, spatially resolved ex situ stellar mass fraction maps. This added complexity requires a more sophisticated machine-learning architecture.
Diffusion models have recently emerged as a powerful class of generative models, achieving state-of-the-art performance in high-quality image/video generation, as well as text-to-image translation, by learning to reverse a gradual noising process applied to data (Song et al. 2020). Recently, they have also seen increasing use in astrophysics – particularly in inverse problems and in modeling complex, high-dimensional data distributions. Notable applications include generating realistic galaxy images (Smith et al. 2022), reconstructing maps of matter distribution (Remy et al. 2023), modeling gravitational lensing systems (Adam et al. 2022; Karchev et al. 2022), reconstructing high-quality observational images across various domains (Wang et al. 2023; Feng et al. 2023, 2024; Drozdova et al. 2024), and accurately characterizing non-Gaussian, anisotropic noise in space-based observations (Legin et al. 2023; Adam et al. 2025).
At a high level, diffusion models learn the underlying data distribution by performing two complementary processes: a forward process, where noise is gradually added to a data point (e.g. an image) until it becomes indistinguishable from pure noise and a reverse process, where noise is iteratively removed to generate new samples from the learned distribution. Crucially, the denoising process is not random – it is guided by the score function, which is defined as the gradient of the logarithm of the data probability density p(x) with respect to the input data x,
 (1)
(1)
This quantity, called the score, points in the direction where the data distribution increases most rapidly in data space. In other words, it tells us how to move x in order to increase its likelihood under the data distribution p(x). A neural network is typically trained to learn the score distribution using Score Matching (Hyvärinen 2005; Vincent 2011). In our case, we use denoising score matching predicting the objective from Song (2019). The noising and denoising processes are described by underlying stochastic differential equations (SDEs). For a detailed mathematical description, we refer the reader to the original work by Song et al. (2020, 2021).
In addition to unconditional generation, diffusion models can be adapted for conditional generation, where the model is guided to produce samples consistent with specific input information. In our case, the model is conditioned on 2D observable IFU-like maps of stellar mass, velocity, and velocity dispersion, enabling us to generate ex situ stellar mass fraction maps that are consistent with observed galaxy properties. In the current work, we use the score-based models from the repository score_models1. A schematic of our architecture can be found in Fig. 1.
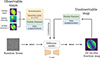 |
Fig. 1. Schematic of the neural network architecture we used to predict 2D spatially resolved maps of the ex situ stellar mass fraction from observable 2D maps of stellar mass density, velocity, and velocity dispersion. A diffusion model is trained to learn the underlying distribution of ex situ maps using the MaNGIA training set, conditioned on the corresponding observable maps (after a series of preprocessing steps; for details, see Section 3.3). |
3.3. Preprocessing
Before training the diffusion model on the MaNGIA dataset, we apply some preprocessing steps to the observable maps (conditions) and the ex situ stellar mass maps. First, we normalize the condition maps by standardizing each IFU map individually. This normalization removes any global information, leaving only the local gradients of the maps. By stripping away mass dependencies, the conditional maps represent the variations in the data, which the diffusion model learns to relate to the spatially resolved ex situ stellar mass fractions. We note here that the same normalization has been applied in our previous works (Angeloudi et al. 2023, 2024), when the same type of observable maps proved robust when the model was calibrated to predict the global ex situ stellar mass fraction across two cosmological simulations.
Additionally, we incorporate Fourier features (FF) into the diffusion model (Kingma et al. 2021; Bourdin et al. 2024) to enhance the conditions and labels. Specifically, we apply Fourier transformations to the IFU-like images (conditions) and the 2D ex situ fraction maps (labels), generating high-frequency sine and cosine components corresponding to the first- and second-order frequencies. These components are concatenated and input into the model. By including this type of Fourier features, the model can capture more spatial variations and high-frequency details in the observed maps and target labels, improving its ability to handle complex, high-dimensional data in the diffusion process.
Finally, we apply specific cuts to the MaNGIA dataset based on total stellar mass and global ex situ stellar mass fraction. We include only synthetic galaxies with stellar mass > 109 M⊙ and fex situ, * > 0.05. This is to ensure some balancing in our dataset in terms of the ex situ stellar mass fraction distributions. Without this cut, the dataset would be biased towards low, flat ex situ stellar mass fraction maps (zero everywhere), complicating the training process. We end up with ∼6300 galaxies that we split into training set (90%) and test set (10%). We note here that the synthetic galaxies in the MaNGIA dataset may be result of the same object from the simulation after applying different projections. We ensure that all projections of the same subhalo are in the same split to avoid data leaks between the training and the validation step.
This dataset is relatively small for the task at hand, but a possible extension is not viable due to the time-consuming mocking procedure. Nevertheless, we find that the model is still able to effectively capture the gradients in the ex situ stellar mass distributions for the majority of galaxies, as will be discussed in the following section. To improve generalization and mitigate overfitting, we apply several data augmentation techniques to the conditions. These include horizontal and vertical flips, random rotations, and random resized crops with varying scales and aspect ratios. Additionally, we introduce Gaussian noise with a standard deviation of σ = 0.5 to the conditions. After adding the noise, the conditions are standardized again to maintain consistency in the input data.
4. Validation on the MaNGIA test set
We train the diffusion model using the designated training set and evaluate its performance on a separate test set reserved for validation. For each test galaxy, we generate 100 samples of the 2D ex situ stellar mass fraction map, conditioned on the three observable input maps: stellar mass density, velocity, and velocity dispersion, all normalized to contain only spatial gradients. We adopt the median of the 100 samples as the final prediction, and use the 84th–16th percentile range to quantify uncertainty.
In Figure 2, we show example reconstructions for three typical galaxies from the test set. Overall, we find that the model is able to reconstruct the ground truth ex situ stellar mass fraction maps with high accuracy. Despite being conditioned only on a limited set of physically informative inputs, it successfully captures complex spatial features across a wide range of ex situ distributions. The model recovers low and high ex situ fractions in different galactic regions with high accuracy, and residuals remain low throughout.
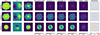 |
Fig. 2. Reconstruction of the ground truth from the diffusion model for three mock galaxies from the MaNGIA test set. The first three columns display the input observable maps provided to the diffusion model: stellar mass, stellar velocity, and velocity dispersion. These maps have been forward-modeled through the MaNGIA pipeline and subsequently normalized to retain only gradient information. The fourth column shows the ground-truth 2D ex situ stellar mass fraction map from the TNG50 cosmological simulation. The fifth and sixth columns present two individual samples from the diffusion model. The seventh column displays the median prediction from 100 samples. Finally, the last two columns show the model uncertainty (computed as the 84th–16th percentile range) and the residual between the median prediction and the ground-truth map, respectively. |
Apart from inspecting individual 2D map reconstructions, we also assess the model’s overall performance across the test set by evaluating its ability to recover global and spatially resolved ex situ stellar mass information. For the global evaluation, we compare the aggregated ex situ stellar mass fraction derived from the predicted 2D maps to the true global value and the value obtained from the ground-truth 2D maps. To compute the aggregated ex situ fraction from the predicted maps, we first recover the ex situ stellar mass at each pixel by multiplying the predicted fraction map with the corresponding stellar mass map. We then sum the total ex situ mass across all pixels and divide by the total stellar mass.
In the first two columns of Figure 3, we show for each galaxy in the test set, the comparison between the aggregated ex situ stellar mass fraction from the predicted 2D map and the true global value (first panel). The second panel presents a complementary comparison between the predicted and true 2D aggregated ex situ fractions, showing consistent agreement and confirming the model’s ability to capture global trends, even for unseen galaxies.
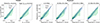 |
Fig. 3. Metrics of accuracy of the diffusion model trained on the MaNGIA dataset. The recovery of the global ex situ stellar mass fraction from 2D predicted map of the model vs. the true global value of the ex situ stellar mass fraction for the train and test set (left). The aggregated ex situ stellar mass fraction from the predicted 2D map vs. the aggregated value from the ground-truth 2D map for the train and test set (middle). The recovery of the regional trends in the predicted map vs. the ground-truth map for the train and test set integrated at different annuli (right). The green solid line denotes the median recovery, and the shaded region covers 68 percent of the test set, representing the prediction scatter. For reference, we also include the same comparison for 1000 training set galaxies in blue, underlining that the model is not overfitting. |
One key advantage of producing 2D maps rather than predicting only global quantities is the ability to probe the radial distribution of ex situ stellar mass. To test the model’s ability to recover such spatial variations, we evaluate the aggregated ex situ stellar mass fraction within several radial apertures, scaled by the galaxy’s effective radius. Each panel in the right hand-side of Figure 3 shows the comparison of predicted versus true ex situ fractions in different radial bins. The calculation follows the same procedure as in the global case but restricted to pixels within each aperture. We can see that the diffusion model is able to recover not only the global information for the mock MaNGIA galaxies from the test set but also the spatial variations in the 2D ex situ stellar mass fraction distributions. Notably, the model shows increasing accuracy toward the outer regions, where the ex situ component typically dominates and displays more prominent gradients.
We conclude that the trained model is able to recover the global as well as the regional ex situ stellar mass fraction distributions, using only observable information from stellar mass and kinematic IFU maps.
5. Application to MaNGA galaxies
5.1. Comparison with 1D predictions
Having demonstrated the effectiveness of the diffusion model in recovering the ex situ stellar mass fraction globally and in a spatially resolved manner from just three observable maps, we now apply our trained and validated model to real galaxy data from the MaNGA survey. The input conditions required to sample the diffusion model–stellar mass, velocity, and velocity dispersion maps–are available for the full sample of ∼10 000 MaNGA galaxies in the same format as the synthetic MaNGIA observables, as they were originally mocked for this purpose. Consequently, no additional preprocessing is necessary beyond the existing pipeline. After normalizing the MaNGA maps to retain only the spatial gradients, we supply them directly to the diffusion model. For each MaNGA galaxy, we generate 10 samples from the model, producing – for the first time – predictions of the 2D ex situ stellar mass fraction distribution across this large observational dataset.
As a first verification of our predictions, we compare the aggregated ex situ stellar mass fractions derived from the 2D maps predicted by the diffusion model to the global ex situ fractions previously estimated for MaNGA galaxies using a CNN-based model (Angeloudi et al. 2024). In that earlier work, we used the same set of observables–stellar mass, velocity, and velocity dispersion maps–to directly predict the integrated ex situ stellar mass fraction. In Figure 4, we show this comparison for the full MaNGA sample of 10 000 galaxies. We find that the relation lies close to the one-to-one line, with the diffusion model generally predicting slightly higher ex situ fractions than the CNN.
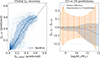 |
Fig. 4. Comparison of the integrated 2D predictions with the 1D predictions from Angeloudi et al. (2024). (a) The recovery of the global ex situ stellar mass fraction from 2D predicted map of the model vs. the predicted global value of the ex situ stellar mass fraction for the MaNGA dataset from previous work. Each point represents a galaxy, and the solid blue line traces the median of the distribution. (b) The median difference of the two predictions as a function of stellar mass. The orange error bars display the median uncertainty per stellar mass bin from the 1D predictions. While the residual between predictions shows a slight increase towards higher stellar masses, it is still covered by the produced uncertainties. The shaded regions enclose 68% of all data. |
This mild offset is expected, given the differences in model architectures and the fact that the diffusion model was trained on a narrower stellar mass range. Moreover, the diffusion model captures higher-order spatial structure in the data, which the CNN is not designed to model, potentially contributing to the observed discrepancies. In the right panel of Figure 4, we additionally show the difference between the two predictions as a function of stellar mass. The solid blue line reveals a trend toward larger deviations at the high-mass end, where the diffusion model tends to predict higher values of ex situ fraction. This difference remains within the uncertainties produced from the 1D CNN-based estimates, however. The main trends identified in our previous work (Angeloudi et al. 2024) remain consistent with the current results, as illustrated in Fig. A.1 in the Appendix A. Overall, this comparison provides a reassuring consistency between the two approaches and supports the validity of our diffusion model’s predictions.
5.2. Radial profiles of ex situ stellar mass fraction
We continue our analysis by examining the spatial information encoded in the 2D ex situ stellar mass fraction maps of the MaNGA galaxies. For each galaxy, we compute the radial profile of the ex situ stellar mass fraction by calculating the fraction at different radii from the galaxy center, normalized by its effective radius (Re). We then stack the radial profiles of all galaxies within three stellar mass bins, and present the results in the left panel of Figure 5.
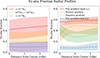 |
Fig. 5. Stacked radial profiles of the ex situ stellar mass fraction for 10 000 MaNGA galaxies as predicted from the diffusion model. (a) The median of the stacked radial profiles separated in 3 stellar mass bins. (b) The median of the stacked radial profiles in each group, following the classification based on the central ex situ gradient. The shaded regions enclose 68% of all data. |
We find that, overall, the radial profiles of the ex situ stellar mass fraction are relatively flat across all stellar mass bins, and follow the expected trend of increasing global ex situ fraction with stellar mass. More specifically, low-mass galaxies (M⋆ < 1010 M⊙) exhibit flat radial profiles with ex situ stellar mass fractions around 0.1 across all radii. Intermediate-mass galaxies (1010 M⊙ < M⋆ < 1011 M⊙) also display flat profiles, but at higher values. High-mass galaxies (M⋆ > 1011 M⊙) show significantly higher ex situ fractions, with central values around 0.4 that increase toward the outskirts, reaching ∼0.5 at 2.5Re.
These trends are consistent with theoretical predictions from cosmological simulations (Rodriguez-Gomez et al. 2016; Davison et al. 2020) and align with results from our previous work (Angeloudi et al. 2024), which established a strong correlation between stellar mass and the ex situ stellar mass fraction. The slight increase in ex situ fraction with radius also agrees with prior literature (e.g. Oser et al. 2010; Rodriguez-Gomez et al. 2016; Davison et al. 2021; Oyarzún et al. 2019), although previous studies often report steeper gradients and higher values in the outer regions. We emphasize, though, that our analysis primarily probes the central regions of galaxies, in contrast to most previous studies that extend to larger radii. Additionally, the stacking procedure used here may smooth out intrinsic variations, potentially removing strong radial gradients that exist in individual galaxies.
5.3. Classes based on the central gradient of the ex situ fraction
To better capture diversity and isolate more extreme behaviors, we divide our MaNGA galaxies based on the central gradient of their predicted ex situ stellar mass fraction. We aim to discover if this classification based on the central gradient can actually trace distinct evolution and merging histories, as well as lead to different observational propoerties. For that, we define the radial gradient/slope s as the difference in median ex situ stellar mass fraction between the inner and intermediate regions of the galaxy,
 (2)
(2)
Based on this slope definition s, we categorized the MaNGA galaxies into four distinct classes:
-
Flat gradient (low ex situ): |s|< 0.05 and fex, 2D < 0.2 in situ dominated galaxies across all radii. This is the most populated class in the MaNGA sample, containing 5909 galaxies (∼58%).
-
Flat gradient (high ex situ): |s|< 0.05 and fex, 2D > 0.4 Accretion-dominated galaxies across all radii. In our MaNGA sample, this class includes 1237 galaxies (∼12%).
-
Positive ex situ gradient: s > 0.075 Galaxies with an in situ dominated central region and an ex situ stellar mass fraction that increases with radius. This class consists of 190 galaxies in our MaNGA sample (∼2%).
-
Negative ex situ gradient: s < −0.075 Galaxies with a highly accreted central region and an ex situ stellar mass fraction that decreases outward. This is this class consists of 330 galaxies (∼3%).
-
Other/Mixed: Galaxies that do not fall into any of the categories above, lying between the defined classes. This group includes 2577 galaxies (∼25%).
This classification enables us to probe deviations from average radial ex situ stellar mass fraction profiles and assess links to galaxy evolutionary histories. The right panel of Figure 5 presents the median radial profiles for each class, which, by construction, exhibit the expected behaviors with respect to distance from the center.
Figure 6 displays 30 representative galaxies per class, highlighting clear differences in spatial structure. Flat gradient (low ex situ) galaxies are dominated by in situ stars throughout, while flat gradient (high ex situ) galaxies maintain a uniformly high ex situ fraction at all radii. Negative ex situ gradient galaxies exhibit centrally peaked ex situ fractions that decline outward. Positive ex situ gradient galaxies show the opposite: low central ex situ fractions and increasingly ex situ dominated outskirts, consistent with inside-out growth and late accretion.
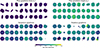 |
Fig. 6. 2D ex situ stellar mass fraction maps for 30 randomly selected galaxies in each group, based on the classification we developed. Each map shows the median of 10 samples predicted by the diffusion model, trained on the MaNGIA mock dataset and conditioned on the stellar mass density and kinematic maps of the corresponding MaNGA galaxy. The different groups display different spatial distributions in their ex situ stellar mass fraction, following our classification scheme. |
We examine the abundances of each group in each stellar mass bin for our MaNGA sample in the left panel of Fig. 7. Flat gradient (low ex situ) galaxies prevail in the low stellar mass bin (∼84%) and become less and less common as we move to higher stellar masses. As the most populous class in our sample, this confirms that the majority of galaxies exhibit flat radial ex situ profiles. On the contrary, flat gradient (high ex situ) galaxies are the dominant class in the high stellar mass bin (∼39%). This is expected from the hierarchical scenario of galaxy evolution, as low mass galaxies typically are impacted less from mergers than high mass galaxies. The negative and positive gradient in ex situ galaxies are less common but are mostly found in intermediate and high stellar mass.
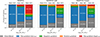 |
Fig. 7. Abundances of the five different groups classified based on the ex situ stellar mass fraction gradient in their inner parts for MaNGA, MaNGIA, and the subest of MaNGIA used for training in three stellar mass bins. The percentages of each group in the respective bin are shown in white bold text and are ommited if they are lower than 10%. The abundances of the groups are different between the observational data and the synthetic data that the diffusion model was trained on. |
We further compare these observed abundances to those derived from the MaNGIA mock dataset (middle panel of Fig. 7), focusing especially on the MaNGIA subsample used to train the diffusion model (right panel of Fig. 7). This comparison can give us insights on the different distributions and diversity between the mock and the observed dataset as well as verify that the model is learning meaningful correlations and not merely mirrors the train set. We find that while the general trends remain consistent – flat-gradient low ex situ galaxies are more common at low stellar mass and other classes increase in fraction toward higher stellar masses – there are notable differences. Specifically, the flat-gradient (high ex situ) class is significantly underrepresented in the mock dataset relative to observatioArgudoFernandezInPrep ns, whereas the negative gradient class is more populous in the high stellar mass bin in MaNGIA than in MaNGA. This indicates that while the model successfully captures meaningful correlations learned from the simulations, the observed galaxy population exhibits a different distribution of ex situ gradient classes, reflecting possible physical diversity between the observations and the simulation.
Apart from the stellar mass dependency, we also examine morphology, star formation activity, kinematics, host dark matter halo mass, and environment across the defined classes (Figure 8). Clear and systematic differences emerge. Flat gradient (low ex situ) galaxies are predominantly disk-dominated, star-forming, fast-rotating systems residing in low-mass halos. Negative gradient galaxies are late- and early-type rotationally supported systems that are located in intermediate-mass halos (log Mhalo < 13), and include star-forming and quenched populations. In contrast, positive gradient galaxies are primarily quenched ellipticals, both fast and slow rotators, and typically reside in more massive halos (log Mhalo > 13), often in clusters or filaments. Flat gradient (high ex situ) galaxies are the most massive, quenched, early-type galaxies in the sample, commonly found in the most massive halos and in cluster centers. The remaining unclassified galaxies represent a mix of properties. A consistent progression across classes is observed in all examined galaxy properties, underlying that the probed gradient in central ex situ stellar mass content is tracing diverse groups of galaxies in terms of their characteristics and assembly histories. Notably, these trends persist across different stellar mass ranges, as demonstrated in Appendix D.
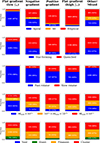 |
Fig. 8. Abundances of different galaxy properties in the five groups of MaNGA galaxies classified based on the ex situ stellar mass fraction gradient in their inner parts. From top to bottom, the different rows illustrate how each group differs in morphology, star formation activity, rotation, host dark matter halo mass, and environment. |
We further investigate these differences through scaling relations shown in Figure 9, where galaxies are color-coded by class. A clear evolutionary sequence emerges: flat gradient (low ex situ) galaxies occupy the low-mass, star-forming, rotationally supported regime, while flat gradient (high ex situ) galaxies dominate the high-mass, quenched, dispersion-supported regime. The positive and negative gradient classes lie between these extremes. Negative gradient galaxies display a mix of star-forming and quenched systems, whereas positive gradient galaxies are predominantly quenched. Slow rotators are concentrated among the flat gradient (high ex situ) and positive gradient classes.
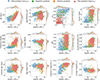 |
Fig. 9. Scaling relations of MaNGA galaxies color-coded by ex situ slope class, showing trends in stellar mass, star formation, rotation, Sérsic index, central velocity dispersion, metallicity, age, their gradients, bulge-to-total ratio, and 1D ex situ fraction (from Angeloudi et al. (2024)). The classes follow a sequence from low-mass star-forming rotationally supported to high-mass quenched dispersion-supported systems. |
The flat gradient (low ex situ) class features lower Sérsic indices, central velocity dispersions, and bulge-to-total ratios, consistent with disk-dominated, rotationally supported galaxies. These systems tend to have younger stellar ages and lower metallicities, with relatively flat radial gradients. In contrast, the flat gradient (high ex situ) and positive gradient classes exhibit higher Sérsic indices, larger central velocity dispersions, and more prominent bulges, reflecting their spheroidal, dispersion-supported nature. These classes also host older, more metal-rich stellar populations. The negative gradient class typically occupies an intermediate position, with properties bridging those of the low and high ex situ slope classes, showing mixed characteristics.
These systematic variations across classes highlight distinct assembly histories and evolutionary paths linked to the spatial distribution of accreted stellar material. Overall, the classes defined by the central ex situ fraction slopes correspond closely to distinct galaxy characteristics and evolutionary stages. Many trends align with the hierarchical evolution model, while others are less intuitive and will be further explored in the next section.
5.4. Recovery of classes in MaNGIA
Since much of the analysis relies on the slope of the ex situ stellar mass fraction in the inner regions, as well as the resulting classification, it is important to test how well these two quantities are recovered in the MaNGIA test set. Such an evaluation is only possible with the mock dataset, where the ground truth can be directly calculated. In Fig. 10, we present the one-to-one recovery of slope values and the confusion matrix for the MaNGIA test set.
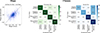 |
Fig. 10. Recovery of the slope and the classes classification in the MaNGIA test set. Left: Comparison between the true and predicted slope in the MaNGIA test set. The one-to-one line is shown for reference. While the model recovers the overall trends, extreme slope values are more difficult to capture. The error bars correspond to the standard deviation of the recovered slopes from the 100 samples. Right: Confusion matrix for the classification on the same test set. Precision is high in all classes (> 84%), meaning false positives are rare. Recall is lower for the underrepresented positive and negative slope classes, which are often classified as the most common flat-slope (low ex situ) class. |
We find that recovering the slope is more difficult than the global and regional metrics shown in Fig. 3, particularly in the most extreme cases. This is expected, since slope recovery was not a primary training target of the diffusion model but a secondary diagnostic introduced for the science analysis. Nevertheless, the predicted slopes broadly follow the one-to-one relation, with larger scatter and uncertainties at the extremes.
We also test how well the four slope classes can be recovered in the MaNGIA test set. To this end, we calculate the confusion matrix, shown in the right panel of Fig. 10, and evaluate precision and recall. Precision measures how often a predicted class is correct. We find that it is high across all classes (> 84%), meaning that when the model assigns a class, it is generally reliable and false positives are rare. Recall, on the other hand, measures how many of the true cases are successfully recovered. Here the model performs less well for the positive and negative slope classes, which are underrepresented in the training data. These cases are frequently classified as the most common flat-slope (low ex situ) class, a typical outcome in highly imbalanced classifications.
Overall, while the classification is not perfect, precision remains very high across all classes. This is the main objective of the analysis, as we emphasize that the diffusion model was not trained specifically for this task; classification was introduced later as a secondary step motivated by the analysis of the recovered results. A more tailored approach would likely improve performance further, but the diffusion model provides higher-order information beyond what a simple classifier can capture. For the statistical goals of this work, the current recovery is sufficient.
6. Discussion
6.1. Connection with merger histories from TNG50
We aim to investigate whether the galaxy classes identified based on their inferred ex situ stellar mass fraction radial profiles indeed correspond to different evolution histories. To this end, we turn to the TNG50 cosmological simulation, from which our MaNGIA training set is derived. In TNG50, we have access to the full merging histories of simulated MaNGIA galaxies, allowing us to directly connect the final observed properties to their past evolution. We apply the same classification scheme introduced previously to the full MaNGIA dataset. As in the observational sample, the most populous class is the flat gradient (low ex situ) galaxies, comprising approximately half of the total sample. The abundances of each group separated by stellar mass can be found in the middle panel of Fig. 7.
In Figure 11, we plot the distribution of several key metrics that summarize the merging histories of MaNGIA galaxies, grouped by their ex situ slope classification. These metrics are derived from TNG50 (Rodriguez-Gomez et al. 2017; Eisert et al. 2023). Specifically, we show: (1) the mean lookback time of mergers, weighted by the stellar mass of the secondary progenitors, which traces when most merger activity occurred; (2) the mean cold gas fraction of merging companions, similarly mass-weighted, which serves as a proxy for the typical gas richness or “wetness” of a galaxy’s accretion history; (3) the mean stellar mass ratio of mergers, indicating the strength of these interactions; and (4) the recent fraction of major mergers, calculated as the number of major mergers divided by the total number of major and minor mergers in the last 5 Gyr, offering a measure of the most frequent recent merger type.
 |
Fig. 11. Distributions of key merger history metrics for MaNGIA galaxies, separated by ex situ slope class. We plot the mean lookback time of mergers, weighted by the stellar mass of the secondary progenitors, reflecting when most mergers occurred; the mean cold gas fraction of merging companions, weighted by their stellar mass, indicating the typical gas richness of the merger history; the mean stellar mass ratio of mergers, also weighted by secondary progenitor mass, characterizing the relative strength of merger events; the fraction of major mergers, calculated as the number of major mergers divided by the total number of major and minor mergers over the last 5 Gyr, highlighting the dominance of major versus minor mergers in recent assembly history. We plot the median value and the error bars correspond to the 68% of the data. |
We find clear distinctions between the classes. Flat gradient (low ex situ) galaxies exhibit the oldest merger lookback times, the highest mean cold gas fractions, and the lowest mean stellar mass ratios and recent major merger fractions -supporting a quiescent, gas-rich accretion history dominated by minor mergers. In contrast, flat gradient (high ex situ) galaxies show the youngest merger lookback times, the highest stellar mass ratios, and the lowest cold gas fractions, consistent with a recent history dominated by dry, major mergers. Negative gradient galaxies present intermediate properties, with relatively early, moderately gas-rich merger activity. This supports the scenario of an early on major merger followed with a more quiescent history. Positive gradient galaxies tend to experience more recent and gas-poor mergers, with elevated stellar mass ratios and a higher fraction of recent major mergers. The key difference between the two most accretion-dominated classes – flat gradient (high ex situ) and positive gradient galaxies – is that the former appears to have undergone somewhat more recent, drier mergers, with a higher major-to-minor merger ratio within the last 5 Gyr.
These results strongly support the interpretation that the differences observed in the present-day ex situ radial profiles are imprints of different merger-driven evolution histories, encoded in the stellar populations of galaxies. Notably, these trends hold across different stellar mass ranges, as shown in Appendix E. A more detailed view of the stacked merger histories for each group is presented in Appendix F, highlighting how the ex situ stellar mass fraction evolves differently over time across the four classes.
6.2. Evolution scenarios
In the previous section, we classified MaNGA galaxies into four categories based on the gradients in their radial ex situ stellar mass fraction profiles within the central regions. We explored how these classes differ in terms of physical and morphological properties, scaling relations, and merging histories using the TNG50 cosmological simulation, from which our MaNGIA training set originates. Based on these comparisons, we propose four distinct evolutionary scenarios that give rise to the observed diversity in the central stellar mass assembly of galaxies. A schematic representation of these scenarios is presented in Figure 12.
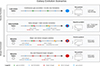 |
Fig. 12. Proposed evolutionary scenarios corresponding to the four classes defined by central ex situ stellar mass fraction gradients. The sequence spans from secularly evolving to merger-dominated systems. |
Across several scaling relations there is some level of overlap among the different classes, starting with flat gradient (low ex situ) typically on one end and leading to flat gradient (high ex situ) on the other, with the remaining two classes in between. This trend likely reflects a physical shift from galaxies with largely secular, in situ star formation histories to systems whose stellar mass assembly is dominated by mergers.
We begin by analyzing our findings on the flat gradient (low ex situ) class. We find that these systems tend to be young, metal-poor, star-forming (76%), with late-type morphologies (87%) and fast-rotating kinematics (98%). Their flat and uniformly low ex situ radial profiles indicate an in situ dominated assembly at all radii. In TNG50, the simulated analogs show quiet merger histories and continuous in situ star formation. Observationally, this is consistent with well-established models of secular disk evolution in low-mass galaxies (Kormendy & Kennicutt 2004; Sellwood 2014). The environments in which these galaxies reside may also have influenced their stellar mass assembly. These systems are typically found in low-mass halos (61%), below the threshold for virial shock heating (Dekel & Birnboim 2006), Mshock < 1012 M⊙. In this regime, cold gas can continuously accrete onto the galaxy, supporting ongoing star formation.
In contrast, the negative gradient class suggests a more complex assembly history. These galaxies show high ex situ stellar mass fractions in their centers that decline with radius. They have both late-type (42%) and early-type morphologies (46%) and fall within an intermediate to high stellar mass range (∼1011 M⊙). Notably, this class includes star-forming (35%) and quenched (65%) populations. On average, their central regions host older stellar populations and higher velocity dispersions, supporting a two-phase formation model. In TNG50, such profiles emerge from early gas-rich major mergers – typically around 7–10 Gyr ago – that lead to a compact, accreted bulge, followed by a prolonged phase of disk regrowth through minor mergers and in situ star formation. We emphasize that these cases only represent a small fraction of galaxies in TNG, however. Previous studies have shown that the majority of bulges, especially in galaxies with M⋆ < 1011 M⊙, formed predominantly through in situ processes, with mergers playing only a minor role in their buildup (Zhang et al. 2025). Results from N-body simulations support that high ex situ mass fractions in the center can emerge from mergers early in the history of the galaxy (Amorisco 2017). The idea that bulges can be largely assembled through early mergers, while disks form later through smoother processes, is also supported by observations (Méndez-Abreu et al. 2021; Baker et al. 2025). The late-type morphology that appears in this class is consistent with inside-out disk growth via minor accretion and extended star formation (van der Wel et al. 2014). Galaxies in this class typically reside in intermediate-mass halos (Mhalo < 1013, 58%), close or slightly above the Mshock threshold. This suggests that cold gas can still penetrate the halo and trigger star formation, further supporting the build-up of an in situ disk from gas accretion along with minor mergers, and possibly explaining the presence of star-forming and quenched galaxies within this class.
The positive gradient and flat gradient (high ex situ) classes are the two classes more closely related in terms of stellar mass and environment. They both have high ex situ stellar mass fractions in their outer regions but differ in their central parts: positive gradient galaxies have an in situ dominated core, whereas flat gradient (high ex situ) galaxies are ex situ dominated at all radii. These are the most merger-dominated systems and are typically hosted by more massive halos, where gravitational collapse is more rapid, enabling an early and compact in situ core to form. Galaxies in both classes may have followed a so-called blue nugget scenario (Barro et al. 2014; Zolotov et al. 2015), where violent disk instabilities, triggered by mergers or gas inflows (common in high-density environments), cause intense central starbursts and bulge formation (Lapiner et al. 2023). Their subsequent growth diverges depending on the accretion history and cold gas availability, however, and it shapes their final radial ex situ profiles.
Galaxies in the positive gradient mainly occupy the high end of the stellar mass range (M⋆ > 1011 M⊙) and are primarily early-type (81%) and quenched systems (84%). Their positive ex situ gradients, coupled with bulge-disk structural distinctions, align with the predictions of two-phase formation models, where early central buildup is followed by late accretion (Rodriguez-Gomez et al. 2016; Davison et al. 2020). The high ex situ stellar mass fractions beyond the in situ-dominated center suggest that these galaxies have undergone mergers with substantial dynamical impact – though not with companions massive enough to reach and dominate the core (Amorisco 2017). In TNG50, galaxies in this class indeed show evidence of a more active merger history, with relatively gas-rich (wet) mergers, which can permit the rejuvenation of the central star formation even after the onset of shock heating (as seen in their MaNGIA merger histories in Fig. 11). This process can preserve or regenerate an in situ core while ex situ stars accumulate predominantly in the outskirts. While these galaxies typically reside in massive halos above the Mshock > 1012 M⊙ threshold (88%), cold flows at high redshift may have further sustained star formation in the center by delivering gas along cosmic web filaments (Dekel & Birnboim 2006; Dekel et al. 2013). Meanwhile, repeated minor mergers built up the ex situ-rich outskirts, producing the observed positive radial gradient in ex situ fraction.
Finally, galaxies in the flat gradient (high ex situ) class are among the most massive in the sample (M⋆ > 1011 M⊙) and are predominantly early-type (89%) and quenched (89%). Their high ex situ content and quenched nature are consistent with previous studies linking rapid quenching to mergers that trigger intense starbursts and AGN activity, ultimately depleting the cold gas reservoir (Rowlands et al. 2018; Belli et al. 2019). Additionally, these systems typically reside in massive halos above the Mshock > 1012 M⊙ threshold (93%), where sustained cold gas inflows are suppressed, further contributing to quenching. In TNG50, these galaxies exhibit a violent merger history, dominated by frequent, massive dry mergers. Such events quench central star formation and build up a stellar structure that is almost entirely accreted. Unlike the positive gradient systems, their merging companions were massive enough to penetrate into the inner regions, depositing ex situ stars even in the core (Amorisco 2017). As a result, they display uniformly high ex situ mass fractions from the center to the outskirts. These systems likely evolved from compact, early-formed progenitors that grew substantially in size through dry accretion – a process consistent with the red nugget scenario (Trujillo et al. 2006; van Dokkum et al. 2008), where dense cores formed at high redshift expand over time via minor and major dry mergers (Kormendy et al. 2009; van Dokkum et al. 2015). The lack of cold gas inflows prevents any rejuvenation of central star formation, resulting in the most merger-built stellar structures in our sample.
A key driver behind these divergent evolutionary paths may be the galaxy environment. In particular, halo mass has been shown to influence stellar population properties (Scholz-Díaz et al. 2024; Oyarzún et al. 2024), and likely plays a central role in shaping stellar mass assembly. Environment affects the frequency and type of mergers, as well as the availability of cold gas. Previous studies have found that higher merger rates–especially those involving dry mergers–are more frequent in overdense environments and galaxy groups (Lin et al. 2010; Jian et al. 2012), while gas accretion is regulated by halo mass and the onset of virial shock heating (Dekel & Birnboim 2006). Together, these factors help explain the observed sequence of ex situ gradients across our classes – from in situ dominated disks in low-mass halos to ex situ dominated ellipticals in massive halos –and are highly consistent with the results we present here.
6.3. Similar classifications in simulations
The four classes we identified exhibit strong similarities with equivalent classes proposed for early-type galaxies (ETGs) in previous works on the IllustrisTNG (TNG100) (Pulsoni et al. 2021) and Magneticum (Remus & Forbes 2022) simulations. These two studies developed classification schemes based on the radial distribution of ex situ stellar mass, although they primarily targeted more massive systems and extended their analysis to significantly larger radii (up to ∼10Re). Despite these differences in sample and spatial coverage, we observe a consistent correspondence in the types of profiles identified. In particular, both studies report an in situ dominated class – less populous in their samples due to the focus on ETGs – and a fully ex situ dominated class, analogs to our flat gradient (low ex situ) and flat gradient (high ex situ) groups, respectively. Their most populous profile closely resembles our positive gradient class, although defined for larger galactic extents. An equivalent to our negative gradient class is also present in both works, including also galaxies that show an ex situ dominated core transitioning to an in situ dominated intermediate region, and then back to ex situ dominance in the outskirts. While we focus exclusively on the central regions, extending our analysis to larger radii would likely reveal similar three-part structures.
These consistencies suggest that the physical mechanisms driving radial variations in stellar mass origin – such as merger timing, mass ratios, and gas content – are robust across mass scales and simulations. Moreover, the merger statistics presented in Pulsoni et al. (2021) closely mirror those we observe in TNG50, reinforcing the validity and broader relevance of the evolutionary pathways we proposed. Overall, these four classes appear to trace a continuum in galaxy assembly histories, from secularly evolving disk galaxies to massive, merger-built ellipticals. Furthermore, the stacked star formation histories for each group, derived from the Firefly value-added catalog (Neumann et al. 2022; Goddard et al. 2017) and presented in Appendix G, further support the proposed evolutionary scenarios.
6.4. Limitations and caveats
While our approach demonstrates strong performance in reconstructing ex situ stellar mass fraction maps, several limitations and caveats remain. First, the size of the training sample (MaNGIA) is relatively small, primarily due to the computational cost of forward-modeling mock observables from cosmological simulations. This constraint limits the diversity of physical conditions represented in the training set and may affect the model’s ability to generalize to galaxies that might not be present in the training distribution. While we found that such cases are not so common, two examples can be found in Appendix C.
Additionally, the current diffusion model is conditioned on only three observable maps – stellar mass density, velocity, and velocity dispersion – each normalized to highlight spatial gradients. While this input is physically meaningful, it may not fully suffice to predict the diverse ex situ stellar mass fraction distribution. Incorporating additional features or data of different modalities could further improve the model’s ability to infer the spatial structure of the ex situ component.
Most importantly, the current method is trained on a particular mock dataset (MaNGIA), derived from the cosmological simulation TNG50. Although we have demonstrated in our previous works that the used conditions, namely the stellar mass density and kinematic maps, are robust predictors of the ex situ stellar mass fraction across different simulations (Angeloudi et al. 2023, 2024), extending this framework to include a broader range of cosmological models and subgrid physics would offer valuable insights into the generalizability of the model. At present, such an expansion is limited by the availability of mock data for IFU surveys. A promising direction might involve adopting a foundation model approach (Parker et al. 2024; Euclid Collaboration: Siudek et al. 2025), however, in which a model is pretrained on a large, heterogeneous dataset including multiple simulations, forward-modeled outputs, and observational data. This strategy could reduce dependence on expensive forward-modeling, enhance predictive robustness, and enable broader applicability across observational datasets and redshifts.
7. Conclusion
We predicted 2D spatially resolved ex situ stellar mass fraction maps for 10 000 galaxies in MaNGA using a diffusion model trained on mock MaNGA analogs (MaNGIA), which were in turn obtained from the TNG50 cosmological simulation. Our main findings are summarized below.
-
The diffusion model accurately recovers the global ex situ stellar mass fraction, obtained by aggregating the predicted 2D maps, and the localized features within different apertures. These predictions were solely based on spatial gradients in stellar mass, velocity, and velocity dispersion maps, and they were validated on an unseen test set from MaNGIA.
-
When applied to MaNGA galaxies, the model generally predicted flat radial profiles for the ex situ stellar mass fraction. In low-mass galaxies, these profiles were centered around low ex situ fractions and show little to no radial dependence between the central regions and larger radii (e.g., 1.5Re to 2.5Re). In more massive systems, the global ex situ fraction increased and a mild radial gradient appeared. Central regions exhibited median ex situ fractions that were lower by ∼0.1 than at 2.5Re.
-
We classified galaxies based on the slope of their predicted ex situ stellar mass fraction profile between the central (r < 0.5Re) and intermediate (0.5Re < r < 1Re) regions. This classification revealed four distinct assembly modes that correlate with galaxy morphology, mass, star formation activity, and merger history. These categories are the following in terms of their ex situ stellar mass fraction in the central regions: flat gradient (low ex situ), negative gradient, positive gradient, and flat gradient (high ex situ). The four distinct classes appear to link spatially resolved ex situ content with different evolutionary pathways.
-
We verified these different merging histories in simulation space by applying the same classification to MaNGIA galaxies. We found consistent trends in the merger frequency, mass ratios, and timing in the four ex situ profile classes.
-
In the classified populations, we observed a clear separation depending on galaxy assembly histories, from secularly evolving low-mass star-forming disks to massive merger-built ellipticals. The slope of the ex situ profile served as a powerful diagnostic of previous accretion processes.
These results demonstrate that generative models can extract detailed formation histories from present-day galaxy kinematics. This offers a new path to spatially resolving assembly histories in large galaxy surveys. In the near future, we plan to extend this method and extract even more direct insights into the merger histories of galaxies, with the goal of applying it to a broad range of IFU surveys that span diverse redshifts and environments.
The code is available at https://github.com/AlexandreAdam/score_models
Acknowledgments
We thank the referee for their constructive comments which improved the clarity of the paper. EA thanks Glenn van de Ven and L. Scholz-Díaz for their insightful discussions. MHC and EA acknowledge financial support from the State Research Agency (AEIMCINN) of the Spanish Ministry of Science and Innovation under the grants “Galaxy Evolution with Artificial Intelligence” with reference PGC2018-100852-A-I00 and “BASALT” with reference PID2021-126838NB-I00. JFB and EA acknowledge support the Spanish Ministry of Science, Innovation and Universities (Grant Nos. PID2019-107427GB-C32 and PID2022-140869NB-I00) and through the project TRACES from the Instituto de Astrofísica de Canarias, which is partially supported through the state budget and the regional budget of the Consejería de Economía, Industria, Comercio y Conocimiento of the Canary Islands Autonomous Community. This work was supported by Mitacs through the Mitacs Globalink Research Award. This research was enabled in part by support provided by the Digital Research Alliance of Canada. This research also made use of computing time available on the high-performance computing systems at the Instituto de Astrofisica de Canarias. The authors wish to acknowledge the contribution of Teide High-Performance Computing facilities to the results of this research. TeideHPC facilities are provided by the Instituto Tecnológico y de Energí?as Renovables (ITER, SA). The author thankfully acknowledges the technical expertise and assistance provided by the Spanish Supercomputing Network (Red Espanola de Supercomputacion), as well as the computer resources used: the Deimos-Diva Supercomputer, located at the Instituto de Astrofisica de Canarias.
References
- Adam, A., Coogan, A., Malkin, N., et al. 2022, Machine Learning and the Physical Sciences Workshop, E1 [Google Scholar]
- Adam, A., Stone, C., Bottrell, C., et al. 2025, AJ, 169, 254 [Google Scholar]
- Amorisco, N. C. 2017, MNRAS, 464, 2882 [Google Scholar]
- Angeloudi, E., Falcón-Barroso, J., Huertas-Company, M., et al. 2023, MNRAS, 523, 5408 [CrossRef] [Google Scholar]
- Angeloudi, E., Falcón-Barroso, J., Huertas-Company, M., et al. 2024, Nat. Astron., 8, 1310 [Google Scholar]
- Baker, W. M., Tacchella, S., Johnson, B. D., et al. 2025, Nat. Astron., 9, 141 [Google Scholar]
- Barro, G., Faber, S. M., Pérez-González, P. G., et al. 2014, ApJ, 791, 52 [Google Scholar]
- Belli, S., Newman, A. B., & Ellis, R. S. 2019, ApJ, 874, 17 [Google Scholar]
- Bickley, R. W., Bottrell, C., Hani, M. H., et al. 2021, MNRAS, 504, 372 [NASA ADS] [CrossRef] [Google Scholar]
- Boecker, A., Leaman, R., van de Ven, G., et al. 2020, MNRAS, 491, 823 [Google Scholar]
- Boecker, A., Neumayer, N., Pillepich, A., et al. 2023, MNRAS, 519, 5202 [NASA ADS] [CrossRef] [Google Scholar]
- Bourdin, A., Legin, R., Ho, M., et al. 2024, ICML 2024 AI for Science Workshop, 212 [Google Scholar]
- Bundy, K., Bershady, M. A., Law, D. R., et al. 2015, ApJ, 798, 7 [Google Scholar]
- Cai, R., Zhu, L., Shen, S., et al. 2025, A&A, 695, A177 [NASA ADS] [CrossRef] [EDP Sciences] [Google Scholar]
- Cannarozzo, C., Leauthaud, A., Oyarzún, G. A., et al. 2023, MNRAS, 520, 5651 [NASA ADS] [CrossRef] [Google Scholar]
- Cappellari, M. 2016, ARA&A, 54, 597 [Google Scholar]
- Ćiprijanović, A., Snyder, G. F., Nord, B., & Peek, J. E. G. 2020, Astron. Comput., 32, 100390 [CrossRef] [Google Scholar]
- Conselice, C. J., Mundy, C. J., Ferreira, L., & Duncan, K. 2022, ApJ, 940, 168 [CrossRef] [Google Scholar]
- Cooper, A. P., D’Souza, R., Kauffmann, G., et al. 2013, MNRAS, 434, 3348 [Google Scholar]
- Cooper, A. P., Gao, L., Guo, Q., et al. 2015, MNRAS, 451, 2703 [Google Scholar]
- Davison, T. A., Norris, M. A., Pfeffer, J. L., Davies, J. J., & Crain, R. A. 2020, MNRAS, 497, 81 [Google Scholar]
- Davison, T. A., Norris, M. A., Leaman, R., et al. 2021, MNRAS, 507, 3089 [NASA ADS] [CrossRef] [Google Scholar]
- Dekel, A., & Birnboim, Y. 2006, MNRAS, 368, 2 [NASA ADS] [CrossRef] [Google Scholar]
- Dekel, A., Zolotov, A., Tweed, D., et al. 2013, MNRAS, 435, 999 [Google Scholar]
- Domínguez Sánchez, H., Margalef, B., Bernardi, M., & Huertas-Company, M. 2022, MNRAS, 509, 4024 [Google Scholar]
- Drozdova, M., Kinakh, V., Bait, O., et al. 2024, A&A, 683, A105 [NASA ADS] [CrossRef] [EDP Sciences] [Google Scholar]
- Duan, Q., Conselice, C. J., Li, Q., et al. 2025, MNRAS, [arXiv:2407.09472] [Google Scholar]
- Duncan, K., Conselice, C. J., Mundy, C., et al. 2019, ApJ, 876, 110 [NASA ADS] [CrossRef] [Google Scholar]
- Eisert, L., Pillepich, A., Nelson, D., et al. 2023, MNRAS, 519, 2199 [Google Scholar]
- Ellison, S. L., Patton, D. R., Simard, L., & McConnachie, A. W. 2008, AJ, 135, 1877 [NASA ADS] [CrossRef] [Google Scholar]
- Euclid Collaboration (Siudek, M., et al.) 2025, A&A, http://dx.doi.org/10.1051/0004-6361/202554611 [Google Scholar]
- Feng, B. T., Smith, J., Rubinstein, M., et al. 2023, arXiv e-prints [arXiv:2304.11751] [Google Scholar]
- Feng, B. T., Bouman, K. L., & Freeman, W. T. 2024, ApJ, 975, 201 [Google Scholar]
- Ferreira, L., Conselice, C. J., Duncan, K., et al. 2020, ApJ, 895, 115 [NASA ADS] [CrossRef] [Google Scholar]
- Ferreira, L., Ellison, S. L., Patton, D. R., et al. 2025, MNRAS, 538, L31 [Google Scholar]
- Goddard, D., Thomas, D., Maraston, C., et al. 2017, MNRAS, 466, 4731 [NASA ADS] [Google Scholar]
- Graham, M. T., Cappellari, M., Li, H., et al. 2018, MNRAS, 477, 4711 [Google Scholar]
- Harmsen, B., Monachesi, A., Bell, E. F., et al. 2017, MNRAS, 466, 1491 [Google Scholar]
- Helmi, A. 2020, ARA&A, 58, 205 [Google Scholar]
- Huang, S., Leauthaud, A., Greene, J. E., et al. 2018, MNRAS, 475, 3348 [Google Scholar]
- Hyvärinen, A. 2005, J. Mach. Learn. Res., 6, 695 [Google Scholar]
- Jian, H.-Y., Lin, L., & Chiueh, T. 2012, ApJ, 754, 26 [NASA ADS] [CrossRef] [Google Scholar]
- Karademir, G. S., Remus, R.-S., Burkert, A., et al. 2019, MNRAS, 487, 318 [Google Scholar]
- Karchev, K., Anau Montel, N., Coogan, A., & Weniger, C. 2022, arXiv e-prints [arXiv:2211.04365] [Google Scholar]
- Kingma, D. P., Salimans, T., Poole, B., & Ho, J. 2021, arXiv e-prints [arXiv:2107.00630] [Google Scholar]
- Koppula, S., Bapst, V., Huertas-Company, M., et al. 2021, arXiv e-prints [arXiv:2102.05182] [Google Scholar]
- Kormendy, J., & Kennicutt, R. C., Jr 2004, ARA&A, 42, 603 [NASA ADS] [CrossRef] [Google Scholar]
- Kormendy, J., Fisher, D. B., Cornell, M. E., & Bender, R. 2009, ApJS, 182, 216 [Google Scholar]
- Lacerda, E. A. D., Sánchez, S. F., Mejía-Narváez, A., et al. 2022, New A, 97, 101895 [NASA ADS] [CrossRef] [Google Scholar]
- Lapiner, S., Dekel, A., Freundlich, J., et al. 2023, MNRAS, 522, 4515 [NASA ADS] [CrossRef] [Google Scholar]
- Legin, R., Adam, A., Hezaveh, Y., & Perreault-Levasseur, L. 2023, ApJ, 949, L41 [Google Scholar]
- Lin, L., Cooper, M. C., Jian, H.-Y., et al. 2010, ApJ, 718, 1158 [NASA ADS] [CrossRef] [Google Scholar]
- López-Sanjuan, C., Le Fèvre, O., Ilbert, O., et al. 2012, A&A, 548, A7 [Google Scholar]
- López-Sanjuan, C., Cenarro, A. J., Varela, J., et al. 2015, A&A, 576, A53 [Google Scholar]
- Man, A. W. S., Zirm, A. W., & Toft, S. 2016, ApJ, 830, 89 [Google Scholar]
- Mantha, K. B., McIntosh, D. H., Brennan, R., et al. 2018, MNRAS, 475, 1549 [NASA ADS] [CrossRef] [Google Scholar]
- Margalef-Bentabol, B., Wang, L., La Marca, A., et al. 2024, A&A, 687, A24 [NASA ADS] [CrossRef] [EDP Sciences] [Google Scholar]
- Méndez-Abreu, J., de Lorenzo-Cáceres, A., & Sánchez, S. F. 2021, MNRAS, 504, 3058 [CrossRef] [Google Scholar]
- Mundy, C. J., Conselice, C. J., Duncan, K. J., et al. 2017, MNRAS, 470, 3507 [Google Scholar]
- Naab, T., Johansson, P. H., & Ostriker, J. P. 2009, ApJ, 699, L178 [Google Scholar]
- Nelson, D., Pillepich, A., Springel, V., et al. 2019, MNRAS, 490, 3234 [Google Scholar]
- Neumann, J., Thomas, D., Maraston, C., et al. 2022, MNRAS, 513, 5988 [NASA ADS] [Google Scholar]
- Oser, L., Ostriker, J. P., Naab, T., Johansson, P. H., & Burkert, A. 2010, ApJ, 725, 2312 [Google Scholar]
- Oyarzún, G. A., Bundy, K., Westfall, K. B., et al. 2019, ApJ, 880, 111 [CrossRef] [Google Scholar]
- Oyarzún, G. A., Tinker, J. L., Bundy, K., Xhakaj, E., & Wyithe, J. S. B. 2024, ApJ, 974, 29 [Google Scholar]
- Parker, L., Lanusse, F., Golkar, S., et al. 2024, MNRAS, 531, 4990 [Google Scholar]
- Patton, D. R., Ellison, S. L., Simard, L., McConnachie, A. W., & Mendel, J. T. 2011, MNRAS, 412, 591 [NASA ADS] [CrossRef] [Google Scholar]
- Pearson, W. J., Rodriguez-Gomez, V., Kruk, S., & Margalef-Bentabol, B. 2024, A&A, 687, A45 [NASA ADS] [CrossRef] [EDP Sciences] [Google Scholar]
- Peebles, P. J. E. 1980, The Large-scale Structure of the Universe (Princeton University Press) [Google Scholar]
- Pillepich, A., Nelson, D., Springel, V., et al. 2019, MNRAS, 490, 3196 [Google Scholar]
- Planck Collaboration XIII. 2016, A&A, 594, A13 [NASA ADS] [CrossRef] [EDP Sciences] [Google Scholar]
- Prieto, M., Eliche-Moral, M. C., Balcells, M., et al. 2013, MNRAS, 428, 999 [Google Scholar]
- Pulsoni, C., Gerhard, O., Arnaboldi, M., et al. 2021, A&A, 647, A95 [EDP Sciences] [Google Scholar]
- Puskás, D., Tacchella, S., Simmonds, C., et al. 2025, MNRAS, [arXiv:2502.01721] [Google Scholar]
- Remus, R.-S., & Forbes, D. A. 2022, ApJ, 935, 37 [NASA ADS] [CrossRef] [Google Scholar]
- Remy, B., Lanusse, F., Jeffrey, N., et al. 2023, A&A, 672, A51 [NASA ADS] [CrossRef] [EDP Sciences] [Google Scholar]
- Rodriguez-Gomez, V., Pillepich, A., Sales, L. V., et al. 2016, MNRAS, 458, 2371 [Google Scholar]
- Rodriguez-Gomez, V., Sales, L. V., Genel, S., et al. 2017, MNRAS, 467, 3083 [Google Scholar]
- Rowlands, K., Wild, V., Bourne, N., et al. 2018, MNRAS, 473, 1168 [NASA ADS] [CrossRef] [Google Scholar]
- Sánchez, S. F., Pérez, E., Sánchez-Blázquez, P., et al. 2016, Rev. Mex. Astron. Astrofis., 52, 171 [Google Scholar]
- Sánchez, S. F., Barrera-Ballesteros, J. K., Lacerda, E., et al. 2022, ApJS, 262, 36 [CrossRef] [Google Scholar]
- Sarmiento, R., Huertas-Company, M., Knapen, J. H., et al. 2023, A&A, 673, A23 [NASA ADS] [CrossRef] [EDP Sciences] [Google Scholar]
- Scholz-Díaz, L., Martín-Navarro, I., Falcón-Barroso, J., Lyubenova, M., & van de Ven, G. 2024, Nat. Astron., 8, 648 [Google Scholar]
- Sellwood, J. A. 2014, Rev. Mod. Phys., 86, 1 [Google Scholar]
- Smercina, A., Bell, E. F., Samuel, J., & D’Souza, R. 2022, ApJ, 930, 69 [Google Scholar]
- Smith, M. J., Geach, J. E., Jackson, R. A., et al. 2022, MNRAS, 511, 1808 [CrossRef] [Google Scholar]
- Somerville, R. S., & Davé, R. 2015, ARA&A, 53, 51 [Google Scholar]
- Song, Y. 2019, arXiv e-prints [arXiv:1907.05600] [Google Scholar]
- Song, Y., Sohl-Dickstein, J., Kingma, D. P., et al. 2020, arXiv e-prints [arXiv:2011.13456] [Google Scholar]
- Song, Y., Durkan, C., Murray, I., & Ermon, S. 2021, arXiv e-prints [arXiv:2101.09258] [Google Scholar]
- Spavone, M., Capaccioli, M., Napolitano, N. R., et al. 2017, A&A, 603, A38 [NASA ADS] [CrossRef] [EDP Sciences] [Google Scholar]
- Tacchella, S., Diemer, B., Hernquist, L., et al. 2019, MNRAS, 487, 5416 [Google Scholar]
- Tinker, J. L. 2021, ApJ, 923, 154 [NASA ADS] [CrossRef] [Google Scholar]
- Trujillo, I., Feulner, G., Goranova, Y., et al. 2006, MNRAS, 373, L36 [NASA ADS] [CrossRef] [Google Scholar]
- van der Wel, A., Franx, M., van Dokkum, P. G., et al. 2014, ApJ, 788, 28 [Google Scholar]
- van Dokkum, P. G., Franx, M., Kriek, M., et al. 2008, ApJ, 677, L5 [Google Scholar]
- van Dokkum, P. G., Nelson, E. J., Franx, M., et al. 2015, ApJ, 813, 23 [NASA ADS] [CrossRef] [Google Scholar]
- Vincent, P. 2011, Neural Comput., 23, 1661 [Google Scholar]
- Wake, D. A., Bundy, K., Diamond-Stanic, A. M., et al. 2017, AJ, 154, 86 [Google Scholar]
- Walmsley, M., Ferguson, A. M. N., Mann, R. G., & Lintott, C. J. 2019, MNRAS, 483, 2968 [NASA ADS] [CrossRef] [Google Scholar]
- Wang, R., Chen, Z., Luo, Q., & Wang, F. 2023, arXiv e-prints [arXiv:2305.09121] [Google Scholar]
- Zhang, L., Zhu, L., Pillepich, A., et al. 2025, A&A, 699, A320 [NASA ADS] [CrossRef] [EDP Sciences] [Google Scholar]
- Zhu, L., Pillepich, A., van de Ven, G., et al. 2022a, A&A, 660, A20 [NASA ADS] [CrossRef] [EDP Sciences] [Google Scholar]
- Zhu, L., van de Ven, G., Leaman, R., et al. 2022b, A&A, 664, A115 [NASA ADS] [CrossRef] [EDP Sciences] [Google Scholar]
- Zolotov, A., Dekel, A., Mandelker, N., et al. 2015, MNRAS, 450, 2327 [Google Scholar]
Appendix A: Global ex situ and in situ stellar mass trends
We recreate Figure 1 from our previous work (Angeloudi et al. 2024), showing the average contribution of the in situ versus ex situ stellar mass in each stellar mass bin for 10,000 MaNGA galaxies using the spatially resolved maps of ex situ stellar mass fraction as predicted from our diffusion model. The result is shown in Fig. A.1 and serves as a validation check of the diffusion model’s predictive capability when extended from the global ex situ stellar mass fractions presented in our previous study (Angeloudi et al. 2024) to full 2D spatial maps.
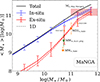 |
Fig. A.1. Recreation of Fig. 1 from Angeloudi et al. (2024), showing the average contributions of ex situ and in situ stellar mass for 10,000 MaNGA galaxies in different stellar mass bins, as predicted by the diffusion model. Solid lines indicate the new measurements derived from the aggregated 2D predicted maps. For reference, the previous 1D predictions from Angeloudi et al. (2024) are shown with dashed lines. The main trends remain consistent between the two works and are in agreement with independent studies of individual galaxies. |
Appendix B: Aperture effects: global ex situ fraction vs 2D aggregation
To check how aperture coverage affects the recovered ex situ mass, we compare the ground-truth ex situ fraction measured within the MaNGIA coverage (1.5Re or 2.5Re) to the true global ex situ fraction from all stellar particles in each galaxy. As shown in Fig. B.1, the two quantities are very close. This is because the MaNGIA aperture already encloses the majority of the stellar mass, and regions outside the aperture contribute relatively little additional ex situ mass. Aperture effects therefore do not strongly change the integrated values used in our analysis.
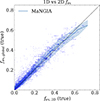 |
Fig. B.1. Comparison between the true global ex situ stellar mass fraction and the true ex situ fraction restricted to the MaNGIA coverage (1.5Re/2.5Re). Each point corresponds to one MaNGIA galaxy. The dashed line indicates the one-to-one relation. The close agreement demonstrates that aperture effects have only a minor impact on the recovered global ex situ fractions. |
Appendix C: Failed reconstruction cases
We present two failed reconstruction cases from our diffusion model in Fig. C.1. In the first row, we show a case where the model successfully captures the large-scale structure but misses finer details, particularly in regions with higher ex situ fractions. In the second row, we present a completely failed reconstruction, where the input maps do not provide sufficient information for the model to reconstruct the ex situ stellar mass fraction distribution, resulting in larger residuals. While such cases are rare, they highlight the inherent limitations of working with a relatively small training dataset.
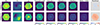 |
Fig. C.1. Failed reconstruction of the ground-truth from the diffusion model for 2 mock galaxies from the MaNGIA test set. |
Appendix D: MaNGA group trends by stellar mass
We recreate Fig. 8 from the main text, separating in stellar mass bins per category. We find that all trends still hold independent of the probed stellar mass, as shown in Fig. D.1.
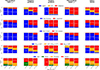 |
Fig. D.1. Galaxy properties across ex situ slope classes, showing clear differences in morphology, star formation, rotation, and environment, also separated by stellar mass. |
Appendix E: MaNGIA merging stats by stellar mass
We recreate Fig. 11 from the main text, separating in stellar mass bins per category. We find that all trends still hold independent of the probed stellar mass, as shown in Fig. E.1.
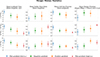 |
Fig. E.1. Distributions of key merger history metrics for MaNGIA galaxies, separated by ex situ slope class. Top: Mean lookback time of mergers, weighted by the stellar mass of the secondary progenitors, reflecting when most mergers occurred. Second row: Mean cold gas fraction of merging companions, weighted by their stellar mass, indicating the typical gas richness of the merger history. Third row: Mean stellar mass ratio of mergers, also weighted by secondary progenitor mass, characterizing the relative strength of merger events. Bottom: Fraction of major mergers, calculated as the number of major mergers divided by the total number of major and minor mergers over the last 2 Gyr, highlighting the dominance of major versus minor mergers in recent assembly history. |
Appendix F: MaNGIA merging histories
For each galaxy in MaNGIA, we attempt to reconstruct its merging history. For that, we follow its main progenitor branch across cosmic time, extracting the ex situ stellar mass and the total stellar mass at every available snapshot. We use the stellar mass assembly catalog by Rodriguez-Gomez et al. (2016), which provide this information in a convenient format. From these, we compute the ex situ stellar mass fraction at each redshift, thus reconstructing the time evolution of the relative contributions of accreted and in situ stars for every galaxy. We then stack the individual histories per class and bin the results into three stellar mass groups, as shown in Figure F.1.
We find that the different classes exhibit distinct assembly histories, both in terms of merger timing and merger mass ratios. Flat gradient (low ex situ) galaxies, dominated by in situ star formation, show a remarkably quiet merger history across cosmic time, consistent with secular evolution and minimal contribution from accreted stars. Negative gradient galaxies tend to have experienced an early major merger (approximately 7–10 Gyr ago), after which their evolution is relatively quiescent. This early, significant accretion event likely built up a dense, ex situ-dominated bulge, while subsequent star formation in the outskirts resulted in a younger, more in situ-dominated disk. Positive gradient galaxies, in contrast, display a more active and recent major merger history. This recent merging activity explains the high ex situ stellar mass fraction in the outskirts, while gas inflows likely triggered central star formation, preserving the in situ-dominated bulge. Finally, flat gradient (high ex situ) galaxies appear to have undergone extremely major mergers throughout their history, resulting in a globally ex situ-dominated stellar mass distribution across all radii.
Appendix G: Star formation histories
We examine the star formation histories (SFHs) in the central regions (r < 0.5Re) of MaNGA galaxies as resolved by the Firefly value-added catalog (Neumann et al. 2022; Goddard et al. 2017). We stack the respective SFHs in each class based on the central ex situ stellar mass fraction gradient to further assess differences in their assembly pathways and plot the results in Fig. G.1. While the differences in the stacked star formation histories are subtle, there exist some trends consistent with the proposed scenarios. The flat gradient (low ex situ) class tends to show continuous star formation, reflecting secular growth. The negative gradient class also shows a smooth history but exhibits two minor dual peaks in stellar age distributions, indicating an early burst followed by more recent star formation. Positive gradient and flat gradient (high ex situ) classes display older stellar populations on average, with a stronger peak on early star formation episodes likely linked to merger-driven assembly. The differences between the two low ex situ classes and between the two high ex situ classes are subtle, however, and their SFHs remain broadly consistent within 1 σ uncertainties. Thus, while these trends support our evolutionary narrative, they should be regarded more as suggestive.
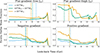 |
Fig. G.1. Stacked ex situ stellar mass fraction histories for different slope classes in MaNGIA. Shown as a function of lookback time, grouped by present-day stellar mass. Each curve represents the median ex situ fraction evolution for galaxies in a given class, showing distinct assembly histories associated with the inferred ex situ radial gradient. |
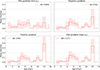 |
Fig. G.2. The star formation histories of the 4 different groups in MaNGA, as resolved by the Firely code. The solid line represents the median of the stacked star formation histories in each group, while the shaded regions cover 68% percent of all data. |
All Figures
|
Fig. 1. Schematic of the neural network architecture we used to predict 2D spatially resolved maps of the ex situ stellar mass fraction from observable 2D maps of stellar mass density, velocity, and velocity dispersion. A diffusion model is trained to learn the underlying distribution of ex situ maps using the MaNGIA training set, conditioned on the corresponding observable maps (after a series of preprocessing steps; for details, see Section 3.3). |
| In the text | |
|
Fig. 2. Reconstruction of the ground truth from the diffusion model for three mock galaxies from the MaNGIA test set. The first three columns display the input observable maps provided to the diffusion model: stellar mass, stellar velocity, and velocity dispersion. These maps have been forward-modeled through the MaNGIA pipeline and subsequently normalized to retain only gradient information. The fourth column shows the ground-truth 2D ex situ stellar mass fraction map from the TNG50 cosmological simulation. The fifth and sixth columns present two individual samples from the diffusion model. The seventh column displays the median prediction from 100 samples. Finally, the last two columns show the model uncertainty (computed as the 84th–16th percentile range) and the residual between the median prediction and the ground-truth map, respectively. |
| In the text | |
|
Fig. 3. Metrics of accuracy of the diffusion model trained on the MaNGIA dataset. The recovery of the global ex situ stellar mass fraction from 2D predicted map of the model vs. the true global value of the ex situ stellar mass fraction for the train and test set (left). The aggregated ex situ stellar mass fraction from the predicted 2D map vs. the aggregated value from the ground-truth 2D map for the train and test set (middle). The recovery of the regional trends in the predicted map vs. the ground-truth map for the train and test set integrated at different annuli (right). The green solid line denotes the median recovery, and the shaded region covers 68 percent of the test set, representing the prediction scatter. For reference, we also include the same comparison for 1000 training set galaxies in blue, underlining that the model is not overfitting. |
| In the text | |
|
Fig. 4. Comparison of the integrated 2D predictions with the 1D predictions from Angeloudi et al. (2024). (a) The recovery of the global ex situ stellar mass fraction from 2D predicted map of the model vs. the predicted global value of the ex situ stellar mass fraction for the MaNGA dataset from previous work. Each point represents a galaxy, and the solid blue line traces the median of the distribution. (b) The median difference of the two predictions as a function of stellar mass. The orange error bars display the median uncertainty per stellar mass bin from the 1D predictions. While the residual between predictions shows a slight increase towards higher stellar masses, it is still covered by the produced uncertainties. The shaded regions enclose 68% of all data. |
| In the text | |
|
Fig. 5. Stacked radial profiles of the ex situ stellar mass fraction for 10 000 MaNGA galaxies as predicted from the diffusion model. (a) The median of the stacked radial profiles separated in 3 stellar mass bins. (b) The median of the stacked radial profiles in each group, following the classification based on the central ex situ gradient. The shaded regions enclose 68% of all data. |
| In the text | |
|
Fig. 6. 2D ex situ stellar mass fraction maps for 30 randomly selected galaxies in each group, based on the classification we developed. Each map shows the median of 10 samples predicted by the diffusion model, trained on the MaNGIA mock dataset and conditioned on the stellar mass density and kinematic maps of the corresponding MaNGA galaxy. The different groups display different spatial distributions in their ex situ stellar mass fraction, following our classification scheme. |
| In the text | |
|
Fig. 7. Abundances of the five different groups classified based on the ex situ stellar mass fraction gradient in their inner parts for MaNGA, MaNGIA, and the subest of MaNGIA used for training in three stellar mass bins. The percentages of each group in the respective bin are shown in white bold text and are ommited if they are lower than 10%. The abundances of the groups are different between the observational data and the synthetic data that the diffusion model was trained on. |
| In the text | |
|
Fig. 8. Abundances of different galaxy properties in the five groups of MaNGA galaxies classified based on the ex situ stellar mass fraction gradient in their inner parts. From top to bottom, the different rows illustrate how each group differs in morphology, star formation activity, rotation, host dark matter halo mass, and environment. |
| In the text | |
|
Fig. 9. Scaling relations of MaNGA galaxies color-coded by ex situ slope class, showing trends in stellar mass, star formation, rotation, Sérsic index, central velocity dispersion, metallicity, age, their gradients, bulge-to-total ratio, and 1D ex situ fraction (from Angeloudi et al. (2024)). The classes follow a sequence from low-mass star-forming rotationally supported to high-mass quenched dispersion-supported systems. |
| In the text | |
|
Fig. 10. Recovery of the slope and the classes classification in the MaNGIA test set. Left: Comparison between the true and predicted slope in the MaNGIA test set. The one-to-one line is shown for reference. While the model recovers the overall trends, extreme slope values are more difficult to capture. The error bars correspond to the standard deviation of the recovered slopes from the 100 samples. Right: Confusion matrix for the classification on the same test set. Precision is high in all classes (> 84%), meaning false positives are rare. Recall is lower for the underrepresented positive and negative slope classes, which are often classified as the most common flat-slope (low ex situ) class. |
| In the text | |
|
Fig. 11. Distributions of key merger history metrics for MaNGIA galaxies, separated by ex situ slope class. We plot the mean lookback time of mergers, weighted by the stellar mass of the secondary progenitors, reflecting when most mergers occurred; the mean cold gas fraction of merging companions, weighted by their stellar mass, indicating the typical gas richness of the merger history; the mean stellar mass ratio of mergers, also weighted by secondary progenitor mass, characterizing the relative strength of merger events; the fraction of major mergers, calculated as the number of major mergers divided by the total number of major and minor mergers over the last 5 Gyr, highlighting the dominance of major versus minor mergers in recent assembly history. We plot the median value and the error bars correspond to the 68% of the data. |
| In the text | |
|
Fig. 12. Proposed evolutionary scenarios corresponding to the four classes defined by central ex situ stellar mass fraction gradients. The sequence spans from secularly evolving to merger-dominated systems. |
| In the text | |
|
Fig. A.1. Recreation of Fig. 1 from Angeloudi et al. (2024), showing the average contributions of ex situ and in situ stellar mass for 10,000 MaNGA galaxies in different stellar mass bins, as predicted by the diffusion model. Solid lines indicate the new measurements derived from the aggregated 2D predicted maps. For reference, the previous 1D predictions from Angeloudi et al. (2024) are shown with dashed lines. The main trends remain consistent between the two works and are in agreement with independent studies of individual galaxies. |
| In the text | |
|
Fig. B.1. Comparison between the true global ex situ stellar mass fraction and the true ex situ fraction restricted to the MaNGIA coverage (1.5Re/2.5Re). Each point corresponds to one MaNGIA galaxy. The dashed line indicates the one-to-one relation. The close agreement demonstrates that aperture effects have only a minor impact on the recovered global ex situ fractions. |
| In the text | |
|
Fig. C.1. Failed reconstruction of the ground-truth from the diffusion model for 2 mock galaxies from the MaNGIA test set. |
| In the text | |
|
Fig. D.1. Galaxy properties across ex situ slope classes, showing clear differences in morphology, star formation, rotation, and environment, also separated by stellar mass. |
| In the text | |
|
Fig. E.1. Distributions of key merger history metrics for MaNGIA galaxies, separated by ex situ slope class. Top: Mean lookback time of mergers, weighted by the stellar mass of the secondary progenitors, reflecting when most mergers occurred. Second row: Mean cold gas fraction of merging companions, weighted by their stellar mass, indicating the typical gas richness of the merger history. Third row: Mean stellar mass ratio of mergers, also weighted by secondary progenitor mass, characterizing the relative strength of merger events. Bottom: Fraction of major mergers, calculated as the number of major mergers divided by the total number of major and minor mergers over the last 2 Gyr, highlighting the dominance of major versus minor mergers in recent assembly history. |
| In the text | |
|
Fig. G.1. Stacked ex situ stellar mass fraction histories for different slope classes in MaNGIA. Shown as a function of lookback time, grouped by present-day stellar mass. Each curve represents the median ex situ fraction evolution for galaxies in a given class, showing distinct assembly histories associated with the inferred ex situ radial gradient. |
| In the text | |
|
Fig. G.2. The star formation histories of the 4 different groups in MaNGA, as resolved by the Firely code. The solid line represents the median of the stacked star formation histories in each group, while the shaded regions cover 68% percent of all data. |
| In the text | |
Current usage metrics show cumulative count of Article Views (full-text article views including HTML views, PDF and ePub downloads, according to the available data) and Abstracts Views on Vision4Press platform.
Data correspond to usage on the plateform after 2015. The current usage metrics is available 48-96 hours after online publication and is updated daily on week days.
Initial download of the metrics may take a while.