Fig. 11.
Download original image
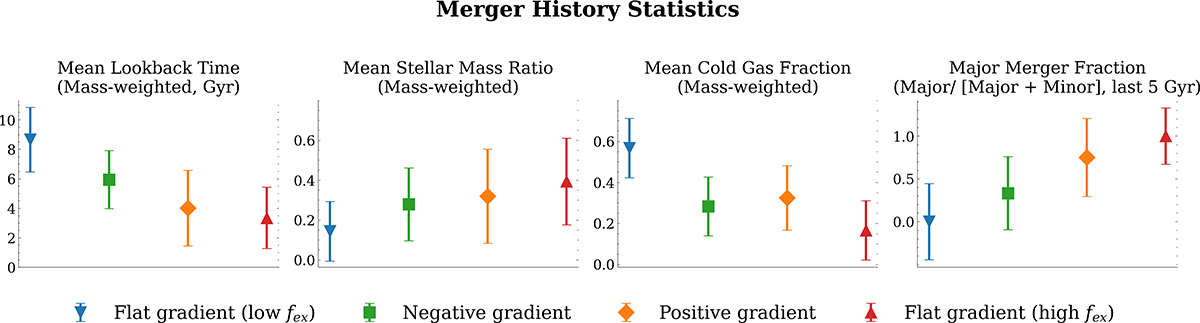
Distributions of key merger history metrics for MaNGIA galaxies, separated by ex situ slope class. We plot the mean lookback time of mergers, weighted by the stellar mass of the secondary progenitors, reflecting when most mergers occurred; the mean cold gas fraction of merging companions, weighted by their stellar mass, indicating the typical gas richness of the merger history; the mean stellar mass ratio of mergers, also weighted by secondary progenitor mass, characterizing the relative strength of merger events; the fraction of major mergers, calculated as the number of major mergers divided by the total number of major and minor mergers over the last 5 Gyr, highlighting the dominance of major versus minor mergers in recent assembly history. We plot the median value and the error bars correspond to the 68% of the data.
Current usage metrics show cumulative count of Article Views (full-text article views including HTML views, PDF and ePub downloads, according to the available data) and Abstracts Views on Vision4Press platform.
Data correspond to usage on the plateform after 2015. The current usage metrics is available 48-96 hours after online publication and is updated daily on week days.
Initial download of the metrics may take a while.