Fig. 3.
Download original image
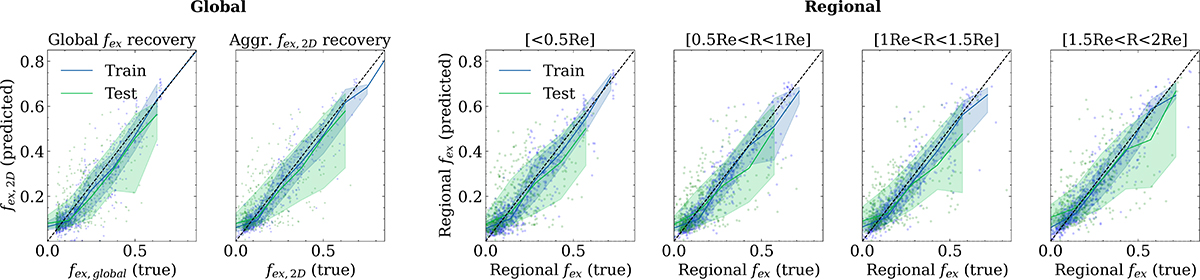
Metrics of accuracy of the diffusion model trained on the MaNGIA dataset. The recovery of the global ex situ stellar mass fraction from 2D predicted map of the model vs. the true global value of the ex situ stellar mass fraction for the train and test set (left). The aggregated ex situ stellar mass fraction from the predicted 2D map vs. the aggregated value from the ground-truth 2D map for the train and test set (middle). The recovery of the regional trends in the predicted map vs. the ground-truth map for the train and test set integrated at different annuli (right). The green solid line denotes the median recovery, and the shaded region covers 68 percent of the test set, representing the prediction scatter. For reference, we also include the same comparison for 1000 training set galaxies in blue, underlining that the model is not overfitting.
Current usage metrics show cumulative count of Article Views (full-text article views including HTML views, PDF and ePub downloads, according to the available data) and Abstracts Views on Vision4Press platform.
Data correspond to usage on the plateform after 2015. The current usage metrics is available 48-96 hours after online publication and is updated daily on week days.
Initial download of the metrics may take a while.