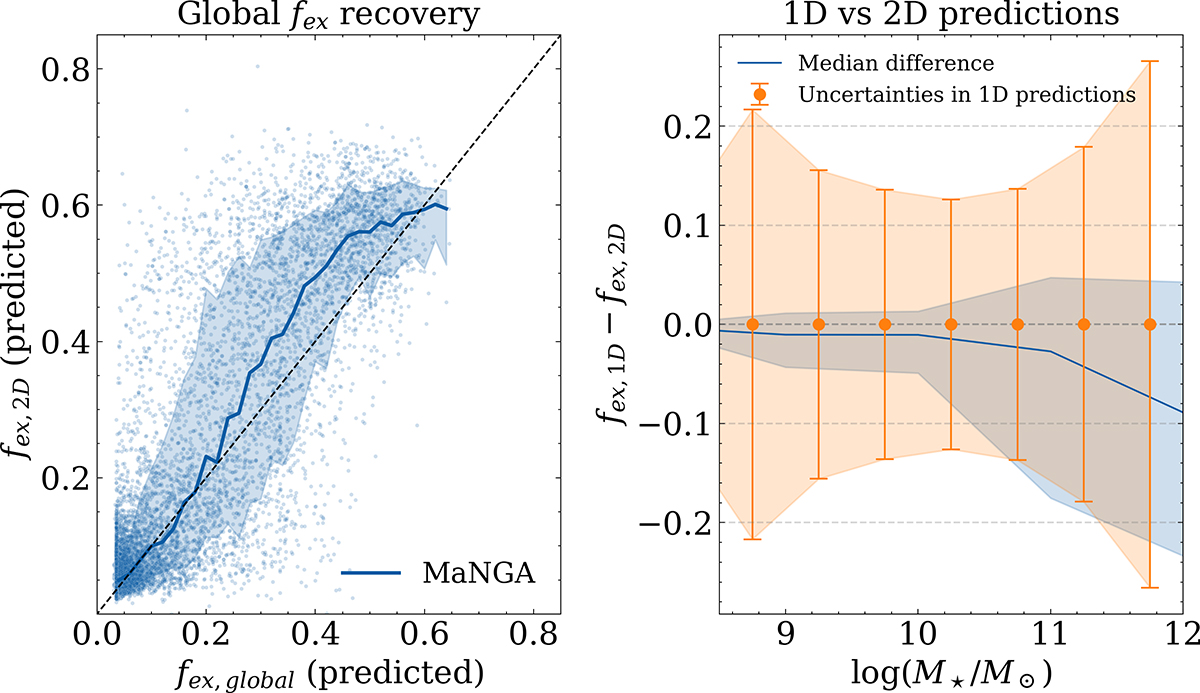
Fig. 4.
Download original image
Comparison of the integrated 2D predictions with the 1D predictions from Angeloudi et al. (2024). (a) The recovery of the global ex situ stellar mass fraction from 2D predicted map of the model vs. the predicted global value of the ex situ stellar mass fraction for the MaNGA dataset from previous work. Each point represents a galaxy, and the solid blue line traces the median of the distribution. (b) The median difference of the two predictions as a function of stellar mass. The orange error bars display the median uncertainty per stellar mass bin from the 1D predictions. While the residual between predictions shows a slight increase towards higher stellar masses, it is still covered by the produced uncertainties. The shaded regions enclose 68% of all data.
Current usage metrics show cumulative count of Article Views (full-text article views including HTML views, PDF and ePub downloads, according to the available data) and Abstracts Views on Vision4Press platform.
Data correspond to usage on the plateform after 2015. The current usage metrics is available 48-96 hours after online publication and is updated daily on week days.
Initial download of the metrics may take a while.