Open Access
Fig. 3.
Download original image
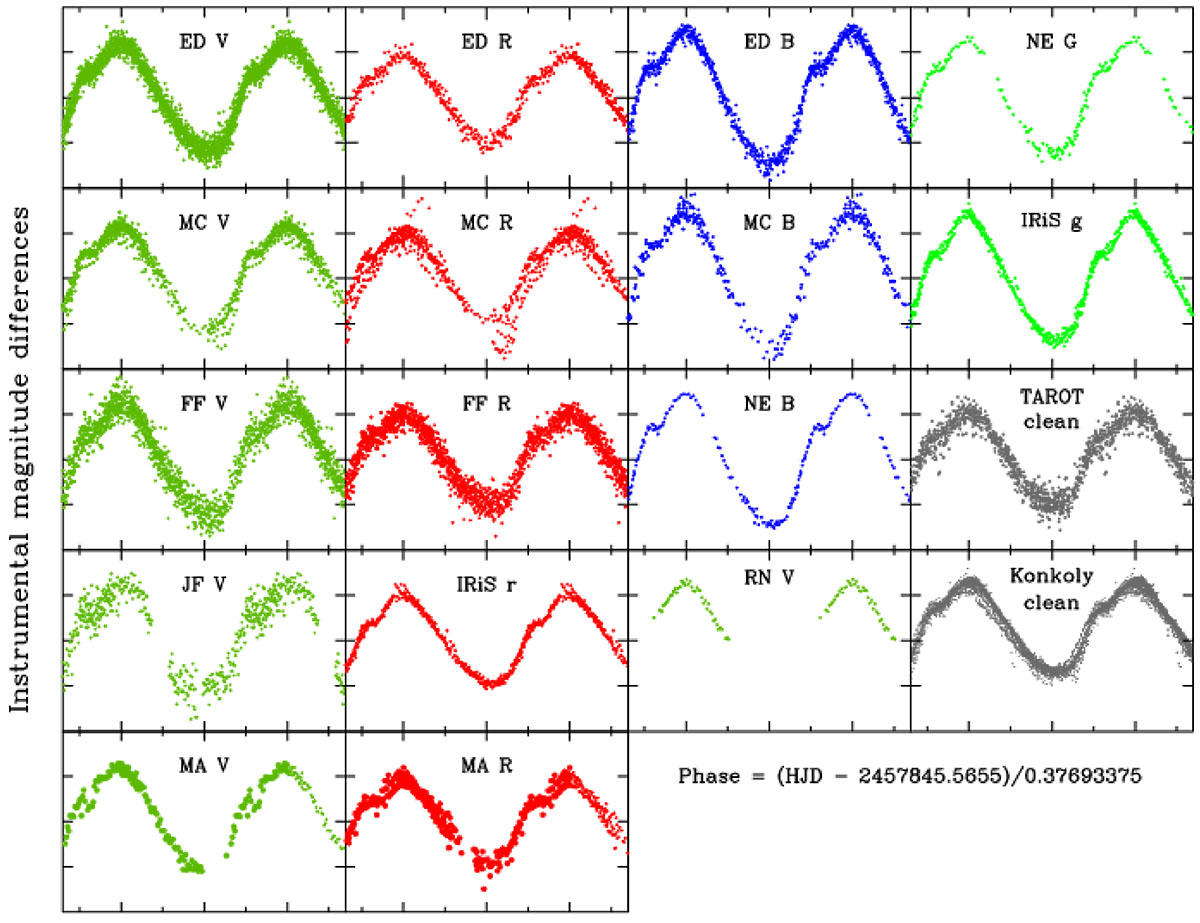
Light curves of KIC 2831097 obtained in 2017 and 2018, folded with the pulsation period. The ticks on the y-axis are separated by 0.20 mag. In each panel, the initials of the observer or the instrument name are given together with the filter.
Current usage metrics show cumulative count of Article Views (full-text article views including HTML views, PDF and ePub downloads, according to the available data) and Abstracts Views on Vision4Press platform.
Data correspond to usage on the plateform after 2015. The current usage metrics is available 48-96 hours after online publication and is updated daily on week days.
Initial download of the metrics may take a while.