| Issue |
A&A
Volume 703, November 2025
|
|
|---|---|---|
| Article Number | A286 | |
| Number of page(s) | 9 | |
| Section | Stellar structure and evolution | |
| DOI | https://doi.org/10.1051/0004-6361/202556279 | |
| Published online | 28 November 2025 | |
The elusive chase for the first RR Lyr star in a binary system: the case of KIC 2831097
1
INAF – Osservatorio Astronomico di Brera, Via E. Bianchi 46, 23807 Merate (LC), Italy
2
Fundación Galileo Galilei-INAF, Rambla José Ana Fernandez Pérez 7, 38712 Breña Baja, TF, Spain
3
GEOS (Groupe Européen d’Observations Stellaires), 23 Parc de Levesville, 28300 Bailleau l’Evêque, France
4
Université de Toulouse, IRAP CNRS UPS, 14 Avenue Edouard Belin, 31400 Toulouse, France
5
LAM, Laboratoire d’Astrophysique de Marseille, 38 Rue Frédéric Joliot Curie, 13013 Marseille, France
6
Agrupació Astronòmica de Sabadell, C/ Prat de la Riba, s/n, 08206 Sabadell, Spain
7
Konkoly Observatory, HUN-REN Research Centre for Astronomy and Earth Sciences, MTA Centre of Excellence, Konkoly Thege Miklós út 15-17, 1121 Budapest, Hungary
8
Observatoire de Chinon, Astronomie en Chinonais, Mairie, Place du Général de Gaulle, 37500 Chinon, France
9
Observatoire St-Martin, 31 Grande Rue, 25330 Amathay Vésigneux, France
10
Osservatorio Calina, Via Nav 17, 6914 Carona, Switzerland
⋆ Corresponding author: This email address is being protected from spambots. You need JavaScript enabled to view it.
Received:
6
July
2025
Accepted:
3
September
2025
Context. The lack of RR Lyr stars in binary systems is an atypical fact when we consider other classes of variables. Therefore, it has become a challenge for observers to detect an RR Lyr variable in a binary system.
Aims. The RR Lyr variable KIC 2831097 was one of the most promising candidates. The phases of maximum brightness in the Kepler photometry showed a regular variation superimposed on a parabolic trend. These variations in the times of maximum brightness (Tmaxs) were interpreted as a possible light-time travel effect (LTTE) in a wide binary and a fast evolutionary change in the period.
Methods. We planned two spectroscopic runs with the FIES instrument mounted at the Nordic Optical Telescope to test the hypothesis of binarity. The observations were programmed at the predicted quadratures of the orbit, when the two mean radial velocities are expected to differ by about 100 km s−1. The GEOS collaboration complemented the spectroscopic survey by a photometric one. We also analysed Gaia time series and intensive TESS photometry.
Results. The radial velocity curves obtained at the quadratures show the same mean radial velocity (-203 km s−1), which rules the possibility of an LTTE out. The constant mean radial velocity, the [Fe/H] content determined from ground-based CCD observations, and the astrometric parameters supplied by Gaia allow us to infer that KIC 2831097 is a single high-velocity metal-poor RRc star belonging to the Galactic halo. We revisited Kepler photometry and detected a weak Blazhko effect consisting of an oscillation of only 1.1% of the period in about 50 d. We also analysed the TESS photometry of Kepler-1601, whose photometry is contaminated by KIC 2831097. We collected 116 Tmaxs, from the ground-based campaign, 103 Tmaxs from TESS, and 4 Tmaxs from Gaia. In total, we have 3624 Tmaxs. Linear ephemerides cannot fit the whole dataset, but only parts of them. The period shows a tendency to decrease in value, as if it were an evolutionary effect, but not at a constant rate.
Conclusions. The spectroscopic and photometric campaigns performed in the framework of a professional-amateur project failed to confirm that KIC 2831097 belongs to a binary system: the chase remains open. As an RR Lyr variable, KIC 2831097 shows an intriguing evolution of the period.
Key words: stars: distances / stars: general / stars: individual: KIC 2831097 / stars: individual: Kepler-1601 / stars: Population II / stars: distances
© The Authors 2025
 Open Access article, published by EDP Sciences, under the terms of the Creative Commons Attribution License (https://creativecommons.org/licenses/by/4.0), which permits unrestricted use, distribution, and reproduction in any medium, provided the original work is properly cited.
This article is published in open access under the Subscribe to Open model. This email address is being protected from spambots. You need JavaScript enabled to view it. to support open access publication.
1. Introduction
While binary systems are widely used to understand the physical mechanisms of many classes of variable stars and to fix their masses and luminosities, no binary system is known in which one of the components is an RR Lyr variable. Searching for such a system is not only a mere observational exercise. Our knowledge on the masses of RR Lyr stars is based on evolutionary and pulsation models. A direct measure is still lacking. The detection of RR Lyr stars that are tied in binary systems might provide accurate masses that might be compared to dynamical, pulsation, and evolutionary masses, and consequently that might verify the hypotheses and assumptions of the theoretical models, for instance, to constrain the transition phase from the red giant branch to the horizontal branch and the late evolution of solar-mass stars.
Unfortunately, the detection of orbital motions in the data of RR Lyr stars is a very hard hunt and results have proved elusive. Because these variables are intrinsically faint, they are mainly observed with photometry. Times of maximum brightness (Tmaxs) are continuously obtained to study evolutionary changes in the period (Le Borgne et al. 2007). Observed minus calculated (O–C) values can also be scrutinised to show the light-time travel effect (LTTE) that arises from the displacement of the RR Lyr star on its orbit and the consequent change in its distance from the observer. Many of the candidate RR Lyr stars in binaries were proposed by studying the O-C plots (Liška et al. 2016a). TU UMa is an interesting case (Wade et al. 1999), but an additional long-term monitoring is necessary to unambiguously confirm the suspected 20 y period (Liška et al. 2016b). The case of OGLE-BLG-RRLYR-02792 was more promising: eclipses were observed to be superimposed on an RR Lyr-like light curve. The star turned out to be overluminous, however, and it was identified as a binary evolution pulsator (BEP; Pietrzyński et al. 2012; Karczmarek et al. 2017). The search for binary RR Lyr in the OGLE-III Galactic bulge data using the O-C method led to a final sample of 12 firm binary candidates (Hajdu et al. 2015), while a search in the entire Optical Gravitational Lensing Experiment (OGLE) database extended the sample to 87 candidates (Hajdu et al. 2021). No candidate has an orbital period shorter than 1000 d, and the expected radial velocity amplitude is very small. Therefore, no candidates have been confirmed spectroscopically.
Systematic spectroscopic surveys are rare because the RR Lyr stars are faint, which places the targets beyond the limit of many spectrographs. A recent comparison of new and literature systemic (or centre–of–mass) radial velocities of 19 RR Lyr stars once more highlighted the intriguing case of TU UMa and suggested three new candidates, SS Leo, ST Leo, and AO Peg (Barnes et al. 2021). Moreover, radial velocity folded curves are needed to show the changes in the systemic velocity caused by the orbital motion, and this implies that each target must be followed for several nights. This type of very time-consuming survey has just started, and several candidates have been proposed, but no clear case has been found so far (Guggenberger et al. 2016).
The proper motion (PM) values provided by Hipparcos and Gaia allowed the investigation of PM anomalies to verify whether they can be ascribed to binarity (Kervella et al. 2019a). Moreover, stars with a common PM might also be members of wide gravitationally bound systems (Kervella et al. 2019b). The examination of the 24 RR Lyr variables among the 2143 stars with PM anomalies or common PM did not provide any sure case, but a sample of nine candidates. As a byproduct of this investigation, possible slow-phase changes were found in the Blazhko star ST Pic, which might be compatible with an LTTE (Abdollahi et al. 2025). We recall that the Blazhko effect is a periodic or quasi-periodic variation in the amplitude and/or phase of the light curve. It was discovered by Sergey Blažko and Lidiya Petrovna Tseraskaya in 1907 (Blažko 1907).
Sylla et al. (2024) proposed a method for separating the Blazhko effect from LTTE or any other cause (e.g. secular period changes or binarity) and applied it to the oscillating O-C values of V1109 Cas. No firm conclusion about binarity was reached, but the possibility of a LTTE remains.
2. The case of KIC 2831097
The Kepler field includes many RR Lyr variables, both already known objects and new discoveries (Benkő et al. 2010). The almost continuous light curve over 4 years supplies a testbed for the analysis of the O-C values in search for cyclic patterns caused by the LTTE.
KIC 2831097 has been proposed as a very promising candidate (Sódor et al. 2017). It is a first-overtone RR Lyr variable (RRc in the nomenclature of variable stars) with a period P = 0.337 d and a light amplitude ΔKp = 0.40 mag. A small amplitude mode has also been detected, with a period of 0.231 d. The period ratio of 0.613 makes KIC 2831097 a member of the RR0.61 group, which is composed of more than 1000 stars (Netzel 2023). This period ratio is caused by harmonics of non-radial modes of degree ℓ = 8 or 9 (Dziembowski 2016). Additional peaks have also been found in the frequency range 1.5–2.5 d−1. They are probably non-radial modes, but the fundamental radial mode might be among them (Fig. 5 in Sódor et al. 2017). This richness of excited modes is common in RR Lyr variables (e.g. Poretti et al. 2010).
KIC 2831097 also shows a long-term irregular modulation of about 47 d that resembles the Blazhko effect (Le Borgne et al. 2012). The O-C curve was interpreted as the sum of two superimposed effects: a linear decrease in the pulsation period, resembling those observed in many RR Lyr variables (Le Borgne et al. 2007), and a well-defined periodicity of 753 d with a full amplitude of 0.04 d (i.e. 58 min).
This periodicity seemed a well-established fact because it was followed for almost two full cycles and repeated itself regularly: it strongly indicated an LTTE. As an intriguing consequence, the O-C amplitude implies a mass of 8 M⊙ and then places the hypothetical companion among black hole candidates (Sódor et al. 2017). The scenario with a black hole was also proposed for MACHO⋆ J050918.712-695015.31, another RRc star with a possible LTTE effect, but it was considered to be not very probable due to high mass of about 60 M⊙ (Derekas et al. 2004). The case of KIC 2831097 appears to be much more promising.
We considered the spectroscopic verification of the LTTE more appropriate and decisive than the photometric verification because the light variability is highly complex. In order to minimise the telescope-time investment, we selected the observation epochs that corresponded to the maximum approaching and receding velocities, i.e. the quadratures of the orbit, as derived from the O-C curve. By monitoring a few pulsation cycles, we were able to measure the systemic velocities at these two epochs. Since the O-C curve has a full amplitude of 0.04 d, the light time to cover the orbital radius is 0.02 d = 1728 s. At the speed of light, this corresponds to 0.52 ⋅ 109 km. By assuming PLTTE = 753 d and a circular orbit (as suggested by the sine-shaped O–C curve), the orbital velocity is 50.2 km s−1. With opposite signs at the quadratures, the difference between the two systemic velocities is expected to be 100.4 km s−1.
This has to be compared to the expected amplitude of the radial velocity (RV) curve that is due to pulsation. The similar RRc variable CM Leo (P = 0.362 d) shows a light amplitude of 0.50 mag in the V band and a RV amplitude of 26.55 km s−1 (Di Fabrizio et al. 2002). Therefore, two RV curves of KIC 2831097 obtained at the quadratures should span two largely disjoint ranges. The additional modes and the Blazhko periodicity have a much weaker effect than the suspected LTTE on the O-C values (Fig. 2 in Sódor et al. 2017). Therefore, they should not be able to significantly change the difference between the two systemic velocities.
3. Observations and data analysis
KIC 2831097 was observed with the Fibre-fed Échelle Spectrograph (FIES), the cross-dispersed spectrograph mounted on the 2.56-m Nordic Optical Telescope (NOT) of the Roque de los Muchachos Observatory in La Palma, covering the wavelength range of 3700−8300 Å (Telting et al. 2014). Because the target is faint and the expected RV amplitude is large, the spectra were taken with the lowest available resolving power (R = 25 000). Observations of the first quadrature were performed on three nights from August 3 to 5, 2017 (14, 15, and 12 spectra, respectively) and those of the second quadrature on three nights from June 1 to 3, 2018 (13, 13, and 7, respectively).
The exposure time was set to 1800 sec, and the spectra were taken continuously throughout the night, in an airmass interval ranging from 1.02 to 2.5. The computed signal-to-noise ratio (S/N) around Hα ranged from 7.5 to 12.1 (median value 9.92) in 2017 and from 8.2 to 12.8 (median value 10.71) in 2018. The FIES Exposure Time Calculator yielded S/N = 13 as an expected value for an airmass of 1.3. The agreement is fine because we took the spectra over a wide airmass range and we have to consider the magnitude variability, not just the observing conditions.
We performed the RV extractions for each spectrum in real time at the telescope by using simple Image Reduction and Analysis Facility (IRAF) functions. The Hα was the only clear line visible in the spectra. At the end of the two observing runs, we re-analysed the spectra and tried different methods to improve the results, but failed to measure any other helpful spectral line. This fact is not due only to the low S/N, but mainly to the metal–poor content of KIC 2831097. The use of the least-squares deconvolution (LSD) technique (Donati et al. 1997) by using masks for metal-poor stars failed to show the mean profile. Therefore, we can deliver RVs computed by fitting a Gaussian to the Hα line alone (RVα) with error bars of ±2.0 km s−1.
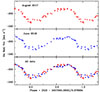 |
Fig. 1. RV measurements of KIC 2831097 folded with the pulsation period. Top panel: measurements taken at the first quadrature in 2017. Middle panel: measurements taken at the second quadrature in 2018. Bottom panel: all measurements. |
4. The non-verification of the LTTE
The two runs at the NOT allowed us to answer the question about the possible LTTE by simply folding the RV measurements with the pulsation period. Table 1 reports the parameters of the least-squares fits obtained with the formula
![$$ \begin{aligned} RV_{\alpha }(t) = RV_{\alpha ,o} + \sum _i^4 {A_i \cos [2\pi if (t-T_o) +\phi _i ]}, \end{aligned} $$](/articles/aa/full_html/2025/11/aa56279-25/aa56279-25-eq1.gif)
where f is the pulsation frequency 1/P, T0 = HJD 2457845.5655, and RVα, 0 is the average velocity of the Hα line.
The 41 RVα measurements obtained at the first quadrature yield a mean velocity RVα, 01 = −203.22 ± 0.48 km s−1. The 33 RVα measurements obtained at the second quadrature yield RVα, 02 = −203.91 ± 0.55 km s−1 (Table 1). The two mean velocities are coincident within the error bars, and the O-C variations can therefore not be ascribed to an LTTE. We recall that the LTTE, if real, should have had a full amplitude of 102 km s−1. The non-significant difference between the two mean RVα strongly suggests that KIC 2831097 is a single star.
Parameters of the least-squares fits of the RVα measurements.
Figure 1 shows the folded RVα curves. The Doppler variation is clearly discernible, even though we used Hα alone and the low-resolution mode. Not only the two mean RVα are coincident, but the RV points of the two runs are almost perfectly superimposed. These two facts suggest a very weak effect of the additional modes. The only difference appears in the standstill observed at the maximum approaching velocity, which corresponds to the start of the expansion after the full contraction of the pulsating star. This standstill is covered better in the 2018 data than in those from 2017, and consequently the Fourier parameters are slightly different (Table 1).
5. The photometric monitoring
The spectroscopic observations ruled out the LTTE as a cause of the O-C variations of KIC 2831097. This still postponed the discovery of the first RR Lyr in a binary system. To search for a different cause, we planned new ground-based photometric observations and analysed data collected by the Kepler (Borucki et al. 2010), Gaia (Gaia Collaboration 2016), and TESS (Ricker et al. 2015) spacecrafts.
5.1. Kepler
Kepler monitored KIC 2831097 almost continuously from June 20, 2009, to May 8, 2013, thus allowing the detection of strong phase variations (Sódor et al. 2017). These variations were measured over 30-d sections of the light curve. In order to determine individual Tmaxs, we slightly modified the approach to the data by fitting the nine harmonics of the pulsation frequency to intervals of 3 d. This interval ensured a good coverage of the pulsation cycle, despite the long-cadence mode (29.4 min time resolution) and allowed us to determine 3391 Tmaxs, spanning 1419 d.
The resulting linear ephemeris is

(standard deviation s.d. = 0.027 d). This ephemeris allowed us to evaluate the change in the period in the JD 2455002-2456420 interval (Fig. 2, top panel). Except for a small offset in the initial epoch, the shape of the O-C plot is almost identical to the previous one (Fig. 2 in Sódor et al. 2017), where the continuous change in the O-C values was fitted as the sum of an evolutionary decreasing period and an orbital solution with a period of 753 d.
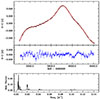 |
Fig. 2. O-C plots of the individual maxima observed by Kepler in 2009-13. Top panel: O-Cs from the linear ephemeris fitted by cubic splines (in red). Middle panel: residual O-Cs from the spline fit. Bottom panel: power spectrum of the residual O-Cs. |
Because the spectroscopic campaign ruled out the binary hypothesis, we firstly fitted the whole 1419 d long O-C curve with a cubic spline (Fig. 2, red line in the top panel) and then plotted the residual O-Cs (Fig. 2, middle panel). The initial and final Tmaxs are not plotted because we know that the fit with a cubic spline is poor at the extrema.
The residual O-Cs show some interesting features. Rapid fluctuations are clearly visible, especially in the 2455200-2455500 time interval, but they seem to be variable in shape, time, and amplitude. Moreover, there are also slow fluctuations, as in the 2456000-2456300 time interval. The frequency analysis of the residual O-Cs clearly illustrates the different regimes (Fig. 2, bottom panel): the group of peaks below 0.01 d−1 are due to the slow oscillations, the double peak at 0.0187 and 0.0205 d−1 (53.4 and 48.7 d, respectively) is due to the Blazhko effect. As it happens when a signal is not constant in phase and/or amplitude, the peak in the power spectrum is split into two or more components.
Our O-C analysis confirms the irregular nature of the Blazhko period detected from the frequency analysis of the Kepler time series (≈47 d, Sódor et al. 2017). We can also infer that the Blazhko effect shows a peak-to-peak amplitude of 0.004 d (Fig. 2, middle panel), corresponding to only 1.1% of the pulsation period.
5.2. Ground-based CCD observations
The Groupe Européen d’Observations Stellaires (GEOS) collaboration ensured a follow-up photometric coverage (Table 2) to obtain new Tmaxs during the spectroscopic observations. The campaign included telescopes located in professional astronomical observatories (OCA, OHP, and Konkoly) and in private observatories managed by well-equipped amateurs astronomers. Thus, the collaboration resulted in a very fruitful Professionals-Amateurs project.
Participants in the photometric campaign on KIC 2831097.
The main goal of the simultaneous campaign was to certify that in the case of binarity KIC 2831097 followed the O-C periodicity that was due to the LTTE. Figure 3 shows the light curves obtained in the framework of the project. The mean amplitudes are 0.60 mag in B light, 0.48 mag in V light, and 0.40 mag in R light. The standstill before the maximum brightness appears to be more pronounced in B light than in R light.
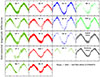 |
Fig. 3. Light curves of KIC 2831097 obtained in 2017 and 2018, folded with the pulsation period. The ticks on the y-axis are separated by 0.20 mag. In each panel, the initials of the observer or the instrument name are given together with the filter. |
The Fourier decomposition of the four V light curves without gaps (ED, MC, MA, and FF) yields values of ϕ31 = ϕ3 − 3ϕ1 in the 4.67-4.98 range, with a mean value ϕ31 = 4.78 ± 0.14. With a period of 0.377 d, KIC 2831097 might be a long-period RRc star (first-overtone pulsators) or a short-period RRab star (fundamental-mode pulsators). The ϕ31 value clearly and unambiguously places it on the RRc sequence (see Fig. 5 in Poretti 2001). The mean ϕ31 = 4.78 ± 0.14 value also allowed us to estimate the metallicity by using the well-known P-[Fe/H]-ϕ31 relation for RRc stars (Eq. (4) in Nemec et al. 2013). We obtained [Fe/H]= − 1.15 ± 0.38 dex.
To complete the description of KIC 2831097 as an RRc variable, we note that the RVα amplitude of 37 km s−1 translates into an amplitude of the metallic lines RVm = 28 km s−1 (Table 11 in Sneden et al. 2017). The RVm and V full amplitudes of KIC 2831097 (28 km s−1 and 0.48 mag) agree very well with the linear relation valid for RRc stars in the Galactic field and globular clusters (Fig. 8 in Sneden et al. 2017).
All the measurements taken in 2017 and in 2018 can be folded with the same period (Fig. 3), and the 111 Tmaxs can be satisfied by the linear ephemeris (s.d. = 0.0065 d)

that is only valid in the JD 2457845-2460820 interval.
On the other hand, the measurements taken in 2016 at the Piszkéstető Station of the Konkoly Observatory are completely off-phase. These measurements are highlighted in light grey in the top panel of Fig. 4. The light curve observed in 2016 appears to be almost in phase opposition (O-C = −0.172 d or O-C = +0.205 d) with respect to those observed in 2017 and 2018 (shown in dark grey).
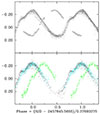 |
Fig. 4. Large shifts of the light curve of KIC 2831097 observed before and after the 2017-18 campaign. Upper panel: no-filter data obtained in 2016 (light grey) and in 2017-18 (dark grey) at the Konkoly Observatory. Lower panel:V light data obtained in 2017-18 (grey points), in 2020 (cyan points), and in 2022 (green points) at the Freixinet observatory. |
The time series taken in 2020 and 2022 also provide an example of a sudden shift. The measurements obtained in 2020 (cyan points in the lower panel of Fig. 4) are still in phase with those obtained on 2017 and 2018 (grey points): the three Tmaxs yield O-Cs of +0.0033, –0.0013 and 0.0028 d. On the other hand, the light curve obtained in 2022 (green points) is clearly shifted forward, and the observed Tmax yields an O-C of +0.0886 d.
To summarise, the Tmaxs obtained by the GEOS collaboration from 2017 to 2020 are well fitted by a linear ephemeris (Eq. (3)), which is certainly no longer valid in 2016 and 2022. Therefore, the pulsation period of KIC 2831097 is highlyvariable.
5.3. Gaia
The Gaia satellite observed KIC 2831097 from September 2014 to May 2017, collecting 47, 47, and 46 data points in the G, Bp, and Rp bands, respectively. Table 3 lists the astrometric and astrophysical parameters extracted from the Data Release 3 (DR3; Gaia Collaboration 2023). The Gaia pulsation parameters are also listed (Clementini et al. 2023). For sake of completeness, we added our determinations of the radial velocity because no value is reported in DR3 and of the [Fe/H] value that we obtained from our more reliable CCD light curves (Fig. 3).
Gaia parameters of KIC 2831097, completed with our measurements of RVα, [Fe/H] and TmaxG.
Figure 5 shows the Gaia photometry in the G, Bp, and Rp bands folded with the DR3 period, i.e. 0.377068±0.000008 d. We obtained a poorly defined light curve when folding all the measurements (top panel). This is a clear sign that the period of KIC 2831097 changed during the three years of the Gaia survey. Therefore, we subdivided the dataset into four subsets, each spanning about 200 d. The scatter of each light curve was then strongly reduced, and the phase shifts caused by the changing period are clearly detected (second, third, fourth, and fifth panel). The same results were obtained for Rp and Bp photometry. The DR3 amplitudes (0.43, 0.36, and 0.25 in Bp, G, and Rp, respectively) decrease from blue to red, like those of GEOS.
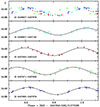 |
Fig. 5. Gaia photometry in the G-band folded with the pulsation period. First panel from top: all the measurements taken. Second panel: measurements taken from JD 2456927 to 2457163. Third panel: measurements taken from JD 2457225 to 2457443. Fourth panel: measurements taken from JD 2457471 to 2457659. Bottom panel: measurements taken from JD 2457685 to 2457879. |
We computed the observed Tmaxs by interpolating the data points with a sinusoid (the solid line in Fig. 5). These four Tmaxs (Table 3) bridge the gap between the Kepler Tmaxs and those of the 2017–18 campaign and greatly helped us to understand the complicated O-C behaviour. We immediately noted that they perfectly bracket the 2016 campaign and clearly confirm the large phase shift.
Gaia DR3 reports a distance d = 3.85 ± 0.12 kpc, as obtained from the General Stellar Parametrizer from Photometry (GSP-Phot). B and V magnitudes of KIC 2831097 are provided by the Exoplanet Follow-up Observation Program (ExoFOP1), i.e. B = 15.465 ± 0.068 and V = 14.907 ± 0.115. Because RRc variables are early-type A stars, B − V = +0.56±0.13 is affected by a high colour excess, as proven by the heavy interstellar absorption measured by Gaia (AG = 1.335 ± 0.008 mag). We obtain an absolute magnitude MV = 0.64 ± 0.12 by combining distance d, magnitude V, and absorption AG, which agrees very well with the MV, RRc = +0.59 ± 0.10 value attributed to RRc stars (Kollmeier et al. 2013).
In this respect, the Gaia DR3 trigonometric parallax (0.1268 ± 0.0156 mas) seems to be underestimated and is probably affected by a large bias (Lindegren et al. 2021). We also note the large difference compared to the DR2 trigonometric parallax, i.e. 0.0394 ± 0.0197 mas.
The Galactic coordinates, the low metallicity, and the high radial velocity strongly suggest that KIC 2831097 is an RRc star belonging to the Galactic halo, where RR Lyr stars are commonly observed (e.g. Gomel et al. 2019).
5.4. TESS
There is no TESS light curve of KIC 2831097≡TIC 120531707 in the Mikulski Archive for Space Telescopes2 (MAST). Nevertheless, we submitted several queries to the archive, also using lightkurve (Lightkurve Collaboration 2018). Our attention was drawn by the light curves of the nearby Kepler-1601≡TIC 120531708, 1.03 mag brighter than KIC 2831097. Kepler-1601 harbours a confirmed transiting exoplanet with an orbital period of 2.209218±0.000014 d and no significant transiting time variations (Gajdoš et al. 2019). No spectroscopic follow-up is available so far.
Kepler-1601 was observed by TESS in the consecutive Sectors 80 (17276 data points) and 81 (16958 data points) from June 17, 2024, to August 30, 2024, with a 2-min short-cadence. KIC 2831097 is just one pixel aside of the aperture masks adopted for Kepler-1601 (Fig. 6). We investigated whether this proximity was able to contaminate the photometry of the main target. We downloaded the time series of TIC 120531707 from the MAST, as processed by the TESS Science Processing Operations Center (SPOC; Jenkins et al. 2016) at NASA Ames Research Center. We used the SPOC Presearch Data Conditioning Simple Aperture Photometry (PDC-SAP) light curves.
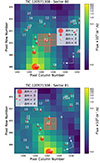 |
Fig. 6. TESS target pixel file of Sectors 80 (upper panel) and 81 (lower) centred on Kepler-1601. The red circle labelled 1 is marked by a white cross. The orange squares delimit the pixels used by the SPOC pipeline to perform the aperture photometry of Kepler-1601. KIC 2831097 is the star labelled 4 in both panels. All sources from the Gaia DR3 catalogue down to a magnitude difference of 4 are shown as red circles, and the size is shown in the inserted legend. The colour bar on the right indicates the electron counts for each pixel. Both plots were built using the code tpfplotter (Aller et al. 2020). |
A regular periodicity of 0.3769 d is clearly visible to eye (Fig. 7, top and middle panels), with a peak-to-peak amplitude that is much larger in Sector 80 than in Sector 81. The position of KIC 2831097 in Sector 81 is on the bottom line of the aperture mask, and its centroid is slightly farther away than in Sector 80 (Fig. 6). This reduces the amount of contaminating light. Our interest was to study KIC 2831097, and we were therefore glad that this happened, but it is a striking example of a false positive, i.e. a light variability not due to the main target, but to a background star. This subtle proximity effect can play an important role in the identification of exoplanetary candidates as well: an eclipsing binary located 1-2 pixels outside the adopted mask can still contaminate the aperture photometry of the main target and mimic an exoplanetary transit.
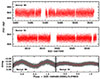 |
Fig. 7. TESS photometry of Kepler-1601 clearly showing the light contamination due to the proximity of KIC 2831097 to the aperture mask. The contribution is larger in Sector 80 (top panel) than in Sector 81 (middle panel). The amplitudes of the fitting curves (in red) of the folded measurements (in grey) are consequently different (bottom panel). |
When transformed into magnitudes, the full amplitudes of the fitting curves (the sum of the pulsation frequency f and its first harmonic 2f) are damped from 0.40 mag to 0.047 mag in Sector 80 and to 0.017 mag in Sector 81 (Fig. 7, bottom panel). These dampings imply that the light from KIC 2831097 contributes to the PDC-SAP flux of Kepler-1601 from 11% (at the phase of mimimum brightness) to 16% (at the phase of maximum brightness) in Sector 80 and from 3.7% to 5.4% in Sector 81. We note that the stars labelled 2 and 3 are even stronger contaminants than KIC 2831097 (Fig. 6). Our goal was to determine the Tmaxs of KIC 2831097, and we therefore did not try to improve the Kepler-1601 photometry.
The TESS time baseline covers 131 pulsation cycles and 114 were captured entirely or in part. The gaps in the light curves (Fig. 7) are due to satellite manoeuvres. Eleven years after Kepler and six years after the ground-based campaigns, the TESS survey can add significant pieces to the puzzle of the period evolution, having in mind the fluctuations in the O-C plot obtained from Kepler data and the off-phase cycles observed in the GEOS campaigns.
The standard deviations of the fits of the folded light curves are 0.0105 and 0.0083 mag in Sectors 80 and 81, respectively. We subdivided the TESS time series into single-pulsation cycles. We computed the least-squares fits with the f and 2f terms and determined their extrema. We were able to extract 103 reliable Tmaxs, disregarding those with an unsatisfactory phase coverage or an excessive scatter. The resulting linear ephemeris is

(s.d. = 0.0060 d), which is valid in the JD 2460480-2560820 interval.
This ephemeris disagrees with the previous one (Eq. (3)) and suggests that a period change has occurred. Since our analysis of the Tmaxs has repeatedly proven that the period of KIC 2831097 is rapidly variable, we resumed GEOS observations when this paper was near completion. Four new Tmaxs collected in May-June 2025 occurred close to the times predicted by Eq. 4, though with increasing positive O-C values.
6. Discussion and conclusions
Our spectroscopic campaign demonstrated that the RR Lyr star KIC 2831097 is not in a binary system because the systemic RVs measured with FIES are constant within a few 0.1 km s−1 and within the error bars. This result is very similar to the result obtained on Z CVn, an RRab star that was also suspected to be a binary member on the basis of the O-C diagram. The binary hypothesis was later disproved by spectroscopic RV measurements (Skarka et al. 2018). Apparently, the wide variety of O-C changes in RR Lyr stars sometimes produces behaviours that resemble LTTE. The cases of KIC 2831097 and Z CVn caution us about these occurrences.
Detailed theoretical investigations are required to determine why RR Lyr are rarely found in binary systems. The most plausible explanation is that the evolution on the red giant branch (RGB) destroys most of the potential RR Lyr variables in binary systems (Bobrick et al. 2024). The core-helium burning star underwent a mass-stripping process whose entity depends on the binary parameters, such as orbital period and mass ratio. Complete stripping leads to subdwarf B stars, and near-complete stripping leads to colder subdwarf A stars. Only partial stripping is able to produce stars that can lie on the intersection of the horizontal branch with the instability strip and then pulsate as RR Lyr variables (Bobrick et al. 2024). The RR Lyr subgroup of evolved RGB binaries should have long periods (Porb > 1000 d) and low mass-ratios (0.45 < q < 2.0). The detection is therefore a hard observation task, both in photometry and spectroscopy, which explains the limited success achieved so far, i.e. just lists of long-period candidates (Hajdu et al. 2015, 2021; Guggenberger et al. 2016).
When LTTE has to be discarded as the cause, we have to consider the O-C variations of KIC 2831097 as a peculiar case of the cyclic period changes of RR Lyr variables. We recovered the Blazhko effect in the Kepler Tmaxs, measuring an oscillation in time of only 0.004 d. Therefore, the O-C variations detected by Kepler are too large to be ascribed to this weak Blazhko effect.
List of the observed times of maximum brightness.
We revisited Kepler, Gaia, and TESS photometry and observed new Tmaxs by means of a Professionals-Amateurs project that involved several amateur astronomers and used professional instruments. Table 4 lists the available 3624 Tmaxs, of KIC 2831097. The Tmaxs are also listed in the GEOS RR Lyr database3 (Le Borgne et al. 2007), which will be continuously updated. It is finally not possible to find a single ephemeris that is valid for several years because there are pieces of evidence of several period changes. We therefore have to limit ourselves to proposing linear ephemerides (Eqs. (2),(3),(4)) that are only valid in restricted time intervals.
In order to provide the most complete picture possible, we tried to reconstruct the O-C trend using just one linear fit. We emphasize that because of the gaps in the Tmax collection, there is a possible ambiguity in the number of cycles that elapsed between the last Kepler Tmax and the next one (the first Gaia Tmax). We were able to obtain the O-C plot shown in Fig. 8 by using the GEOS ephemeris (Eq. 3) as reference. This plot shows the continuous decrease in the period, which is still ongoing, with superimposed slow and fast oscillations. We must definitely conclude that the period does not seem to remain constant for a long time, but based on the tendency to decrease in value, we might argue that it is an evolutionary effect, but not at a constant rate. Although not in a binary system, it seems that KIC 2831097 deserves a continuous monitoring in the next years because it might provide useful insights into the evolutionary period changes of RRc variables.
The O-C plot of KIC 2831097 can also be compared to those recently obtained on other RRc stars. Differently from KIC 2831097, the periods of BE Dor (P = 0.328 d) and KIC 9453114 (P = 0.366 d) show continuous oscillations, without a clear trend to increase or decrease. Recently, these oscillations were tentatively ascribed to the turbulent convection inside the hydrogen and helium ionization zones (Li et al. 2022), which are cyclically weakened and strengthened owing to the presence of a transient magnetic field (Stothers 2006). The variations in the convective envelope cannot explain the short periods of the Blazhko effect (Molnár et al. 2012), but they can enable the long-term (P > 100 d) modulations. The critical point remains the lack of pieces of evidence that magnetic fields are active in RR Lyr stars, however (Kolenberg & Bagnulo 2009).
On the other hand, instabilities during the final phase of the helium-core burning can explain the irregular period variations or the long-term oscillations, which are both around a constant value or superimposed on the evolutionary trend (Sweigart & Demarque 1973; Sweigart & Renzini 1979). After the analysis of the Tmaxs of KIC 2831097, we still consider evolutionary changes as the main cause of the period variations, as proven by the agreement between theoretical predictions (Lee 1991) and observed rate changes (Le Borgne et al. 2007) in a large sample of RR Lyr stars.
Data availability
Full Table 4 is available at the CDS via https://cdsarc.cds.unistra.fr/viz-bin/cat/J/A+A/703/A286.
Acknowledgments
Based on observations made with the Nordic Optical Telescope, operated by the Nordic Optical Telescope Scientific Association at the Observatorio del Roque de los Muchachos, La Palma, Spain, under the proposals 55-024 and 57-014 (P.I. E. Poretti). E.P. thanks the whole NOT staff for the help in the observations, performed in visitor mode. The authors thank Cécil Loup and Marek Skarka for enlightening discussions. The outlines of this project were sketched during several GEOS meetings, where the different knowledge of amateur and professional astronomers found a very profitable synthesis. The active participation of M. Benucci, G. Boistel, R. Boninsegna, R. Dequinze, G. Domènech, M. Dumont, J. Fabregat, S. Ferrand, F. Libotte, J.C. Misson, J. Remis, J. Vandenbroere, J.M. Vilalta to these events is gratefully acknowledged. Á.S. acknowledges the financial support of the KKP-137523 “SeismoLab” Élvonal grant of the Hungarian Research, Development and Innovation Office (NKFIH). We made extensive use of the SIMBAD database, operated at CDS, Strasbourg, France. This work has made use of data from the European Space Agency (ESA) mission Gaia (https://www.cosmos.esa.int/gaia), processed by the Gaia Data Processing and Analysis Consortium (DPAC, https://www.cosmos.esa.int/web/gaia/dpac/consortium). Funding for the DPAC has been provided by national institutions, in particular the institutions participating in the Gaia Multilateral Agreement. This research has made use of IRAF, distributed by the Community Science and Data Center at NSF NOIRLab, which is managed by the Association of Universities for Research in Astronomy (AURA) under a cooperative agreement with the U.S. National Science Foundation. This research has made use of the Exoplanet Follow-up Observation Program (ExoFOP; DOI: 10.26134/ExoFOP5) website, which is operated by the California Institute of Technology, under contract with the National Aeronautics and Space Administration under the Exoplanet Exploration Program. This research has made use of Lightkurve, a Python package for Kepler and TESS data analysis and of tpfplotter by J. Lillo-Box (publicly available in www.github.com/jlillo/tpfplotter); both use in turn the python packages astropy, matplotlib and numpy.
References
- Abdollahi, H., Molnár, L., & Varga, V. 2025, A&A, 695, L14 [NASA ADS] [CrossRef] [EDP Sciences] [Google Scholar]
- Aller, A., Lillo-Box, J., Jones, D., Miranda, L. F., & Barceló Forteza, S. 2020, A&A, 635, A128 [NASA ADS] [CrossRef] [EDP Sciences] [Google Scholar]
- Barnes, T. G., III, Guggenberger, E., & Kolenberg, K. 2021, AJ, 162, 117 [Google Scholar]
- Benkő, J. M., Kolenberg, K., Szabó, R., et al. 2010, MNRAS, 409, 1585 [CrossRef] [Google Scholar]
- Blažko, S. 1907, Astron. Nachr., 175, 325 [Google Scholar]
- Bobrick, A., Iorio, G., Belokurov, V., et al. 2024, MNRAS, 527, 12196 [Google Scholar]
- Borucki, W. J., Koch, D., Basri, G., et al. 2010, Science, 327, 977 [Google Scholar]
- Clementini, G., Ripepi, V., Garofalo, A., et al. 2023, A&A, 674, A18 [NASA ADS] [CrossRef] [EDP Sciences] [Google Scholar]
- Derekas, A., Kiss, L. L., Udalski, A., Bedding, T. R., & Szatmáry, K. 2004, MNRAS, 354, 821 [Google Scholar]
- Di Fabrizio, L., Clementini, G., Marconi, M., et al. 2002, MNRAS, 336, 841 [Google Scholar]
- Donati, J. F., Semel, M., Carter, B. D., Rees, D. E., & Collier Cameron, A. 1997, MNRAS, 291, 658 [Google Scholar]
- Dziembowski, W. A. 2016, Commun. Konkoly Obs. Hungary, 105, 23 [NASA ADS] [Google Scholar]
- Gaia Collaboration (Prusti, T., et al.) 2016, A&A, 595, A1 [NASA ADS] [CrossRef] [EDP Sciences] [Google Scholar]
- Gaia Collaboration (Vallenari, A., et al.) 2023, A&A, 674, A1 [NASA ADS] [CrossRef] [EDP Sciences] [Google Scholar]
- Gajdoš, P., Vaňko, M., & Parimucha, Š. 2019, Res. Astron. Astrophys., 19, 041 [Google Scholar]
- Gomel, R., Shahaf, S., Mazeh, T., et al. 2019, MNRAS, 482, 5327 [Google Scholar]
- Guggenberger, E., Barnes, T. G., & Kolenberg, K. 2016, Commun. Konkoly Obs. Hungary, 105, 145 [Google Scholar]
- Hajdu, G., Catelan, M., Jurcsik, J., et al. 2015, MNRAS, 449, L113 [NASA ADS] [CrossRef] [Google Scholar]
- Hajdu, G., Pietrzyński, G., Jurcsik, J., et al. 2021, ApJ, 915, 50 [NASA ADS] [CrossRef] [Google Scholar]
- Jenkins, J. M., Twicken, J. D., McCauliff, S., et al. 2016, SPIE Conf. Ser., 9913, 99133E [Google Scholar]
- Karczmarek, P., Wiktorowicz, G., Iłkiewicz, K., et al. 2017, MNRAS, 466, 2842 [CrossRef] [Google Scholar]
- Kervella, P., Gallenne, A., Remage Evans, N., et al. 2019a, A&A, 623, A116 [NASA ADS] [CrossRef] [EDP Sciences] [Google Scholar]
- Kervella, P., Gallenne, A., Evans, N. R., et al. 2019b, A&A, 623, A117 [NASA ADS] [CrossRef] [EDP Sciences] [Google Scholar]
- Kolenberg, K., & Bagnulo, S. 2009, A&A, 498, 543 [NASA ADS] [CrossRef] [EDP Sciences] [Google Scholar]
- Kollmeier, J. A., Szczygieł, D. M., Burns, C. R., et al. 2013, ApJ, 775, 57 [NASA ADS] [CrossRef] [Google Scholar]
- Le Borgne, J. F., Paschke, A., Vandenbroere, J., et al. 2007, A&A, 476, 307 [EDP Sciences] [Google Scholar]
- Le Borgne, J. F., Klotz, A., Poretti, E., et al. 2012, AJ, 144, 39 [Google Scholar]
- Lee, Y.-W. 1991, ApJ, 367, 524 [Google Scholar]
- Li, L. J., Qian, S. B., & Zhu, L. Y. 2022, MNRAS, 510, 6050 [Google Scholar]
- Lightkurve Collaboration (Cardoso, J.V.d.M., et al.) 2018, Astrophysics Source Code Library [record ascl: 1812.013] [Google Scholar]
- Lindegren, L., Bastian, U., Biermann, M., et al. 2021, A&A, 649, A4 [EDP Sciences] [Google Scholar]
- Liška, J., Skarka, M., Zejda, M., Mikulášek, Z., & de Villiers, S. N. 2016a, MNRAS, 459, 4360 [NASA ADS] [CrossRef] [Google Scholar]
- Liška, J., Skarka, M., Mikulášek, Z., Zejda, M., & Chrastina, M. 2016b, A&A, 589, A94 [CrossRef] [EDP Sciences] [Google Scholar]
- Molnár, L., Kolláth, Z., & Szabó, R. 2012, MNRAS, 424, 31 [Google Scholar]
- Nemec, J. M., Cohen, J. G., Ripepi, V., et al. 2013, ApJ, 773, 181 [CrossRef] [Google Scholar]
- Netzel, H. 2023, Mem. Soc. Astron. It., 94, 48 [Google Scholar]
- Pietrzyński, G., Thompson, I. B., Gieren, W., et al. 2012, Nature, 484, 75 [CrossRef] [Google Scholar]
- Poretti, E. 2001, A&A, 371, 986 [NASA ADS] [CrossRef] [EDP Sciences] [Google Scholar]
- Poretti, E., Paparó, M., Deleuil, M., et al. 2010, A&A, 520, A108 [NASA ADS] [CrossRef] [EDP Sciences] [Google Scholar]
- Ricker, G. R., Winn, J. N., Vanderspek, R., et al. 2015, J. Astron. Telescopes Instrum. Syst., 1, 014003 [Google Scholar]
- Skarka, M., Liška, J., Dřevěný, R., et al. 2018, MNRAS, 474, 824 [Google Scholar]
- Sneden, C., Preston, G. W., Chadid, M., & Adamów, M. 2017, ApJ, 848, 68 [Google Scholar]
- Sódor, Á., Skarka, M., Liška, J., & Bognár, Z. 2017, MNRAS, 465, L1 [CrossRef] [Google Scholar]
- Stothers, R. B. 2006, ApJ, 652, 643 [Google Scholar]
- Sweigart, A. V., & Demarque, P. 1973, Astrophys. Space Sci. Libr., 36, 221 [Google Scholar]
- Sweigart, A. V., & Renzini, A. 1979, A&A, 71, 66 [NASA ADS] [Google Scholar]
- Sylla, S., Kolenberg, K., Klotz, A., et al. 2024, A&A, 691, A108 [NASA ADS] [CrossRef] [EDP Sciences] [Google Scholar]
- Telting, J. H., Avila, G., Buchhave, L., et al. 2014, Astron. Nachr., 335, 41 [Google Scholar]
- Wade, R. A., Donley, J., Fried, R., White, R. E., & Saha, A. 1999, AJ, 118, 2442 [NASA ADS] [CrossRef] [Google Scholar]
All Tables
Gaia parameters of KIC 2831097, completed with our measurements of RVα, [Fe/H] and TmaxG.
All Figures
|
Fig. 1. RV measurements of KIC 2831097 folded with the pulsation period. Top panel: measurements taken at the first quadrature in 2017. Middle panel: measurements taken at the second quadrature in 2018. Bottom panel: all measurements. |
| In the text | |
|
Fig. 2. O-C plots of the individual maxima observed by Kepler in 2009-13. Top panel: O-Cs from the linear ephemeris fitted by cubic splines (in red). Middle panel: residual O-Cs from the spline fit. Bottom panel: power spectrum of the residual O-Cs. |
| In the text | |
|
Fig. 3. Light curves of KIC 2831097 obtained in 2017 and 2018, folded with the pulsation period. The ticks on the y-axis are separated by 0.20 mag. In each panel, the initials of the observer or the instrument name are given together with the filter. |
| In the text | |
|
Fig. 4. Large shifts of the light curve of KIC 2831097 observed before and after the 2017-18 campaign. Upper panel: no-filter data obtained in 2016 (light grey) and in 2017-18 (dark grey) at the Konkoly Observatory. Lower panel:V light data obtained in 2017-18 (grey points), in 2020 (cyan points), and in 2022 (green points) at the Freixinet observatory. |
| In the text | |
|
Fig. 5. Gaia photometry in the G-band folded with the pulsation period. First panel from top: all the measurements taken. Second panel: measurements taken from JD 2456927 to 2457163. Third panel: measurements taken from JD 2457225 to 2457443. Fourth panel: measurements taken from JD 2457471 to 2457659. Bottom panel: measurements taken from JD 2457685 to 2457879. |
| In the text | |
|
Fig. 6. TESS target pixel file of Sectors 80 (upper panel) and 81 (lower) centred on Kepler-1601. The red circle labelled 1 is marked by a white cross. The orange squares delimit the pixels used by the SPOC pipeline to perform the aperture photometry of Kepler-1601. KIC 2831097 is the star labelled 4 in both panels. All sources from the Gaia DR3 catalogue down to a magnitude difference of 4 are shown as red circles, and the size is shown in the inserted legend. The colour bar on the right indicates the electron counts for each pixel. Both plots were built using the code tpfplotter (Aller et al. 2020). |
| In the text | |
|
Fig. 7. TESS photometry of Kepler-1601 clearly showing the light contamination due to the proximity of KIC 2831097 to the aperture mask. The contribution is larger in Sector 80 (top panel) than in Sector 81 (middle panel). The amplitudes of the fitting curves (in red) of the folded measurements (in grey) are consequently different (bottom panel). |
| In the text | |
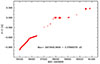 |
Fig. 8. O-Cs of the Tmaxs computed by using a single linear ephemeris (Eq. 3). |
| In the text | |
Current usage metrics show cumulative count of Article Views (full-text article views including HTML views, PDF and ePub downloads, according to the available data) and Abstracts Views on Vision4Press platform.
Data correspond to usage on the plateform after 2015. The current usage metrics is available 48-96 hours after online publication and is updated daily on week days.
Initial download of the metrics may take a while.