Fig. 7.
Download original image
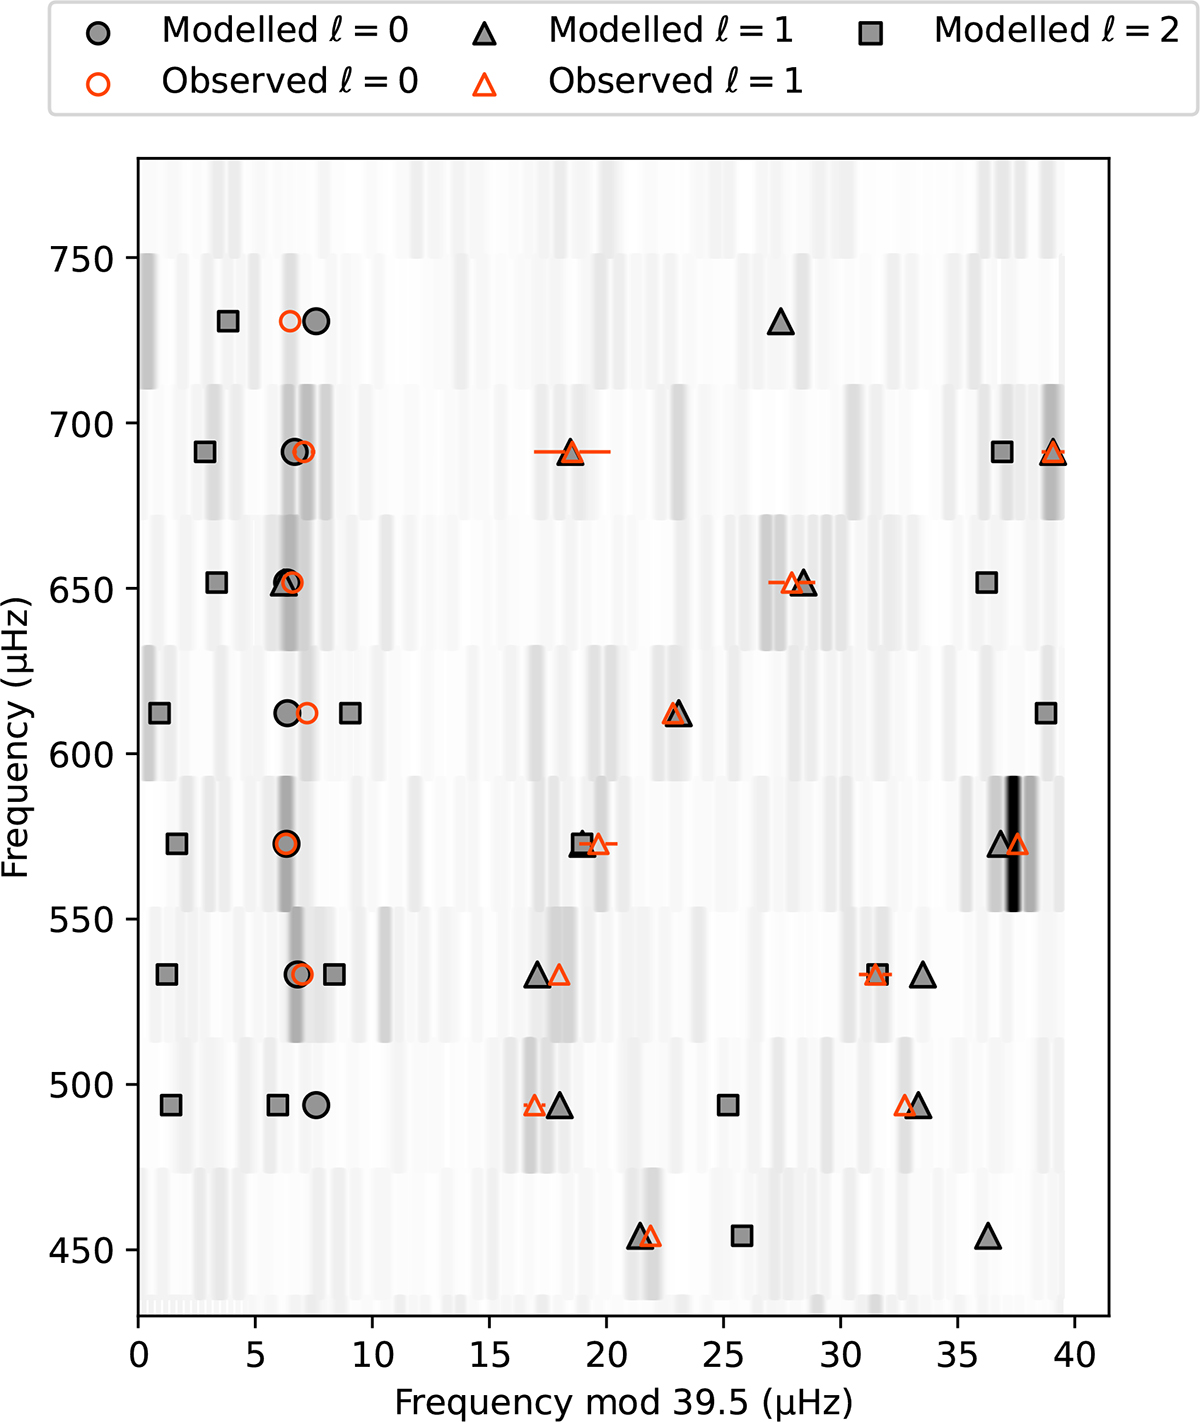
Échelle diagram showing the observed (orange) and modelled (grey) mode frequencies for ℓ = 0 (circles), ℓ = 1 (triangles), and modelled ℓ = 2 (squares). The observed modes are plotted with their 1σ uncertainties in the horizontal direction if these are larger than the symbol used. The straight ridge of the radial modes and the mixed-mode behaviour of the dipolar modes are evident. Note that model modes without an observed counterpart are also plotted.
Current usage metrics show cumulative count of Article Views (full-text article views including HTML views, PDF and ePub downloads, according to the available data) and Abstracts Views on Vision4Press platform.
Data correspond to usage on the plateform after 2015. The current usage metrics is available 48-96 hours after online publication and is updated daily on week days.
Initial download of the metrics may take a while.