Open Access
Fig. 4
Download original image
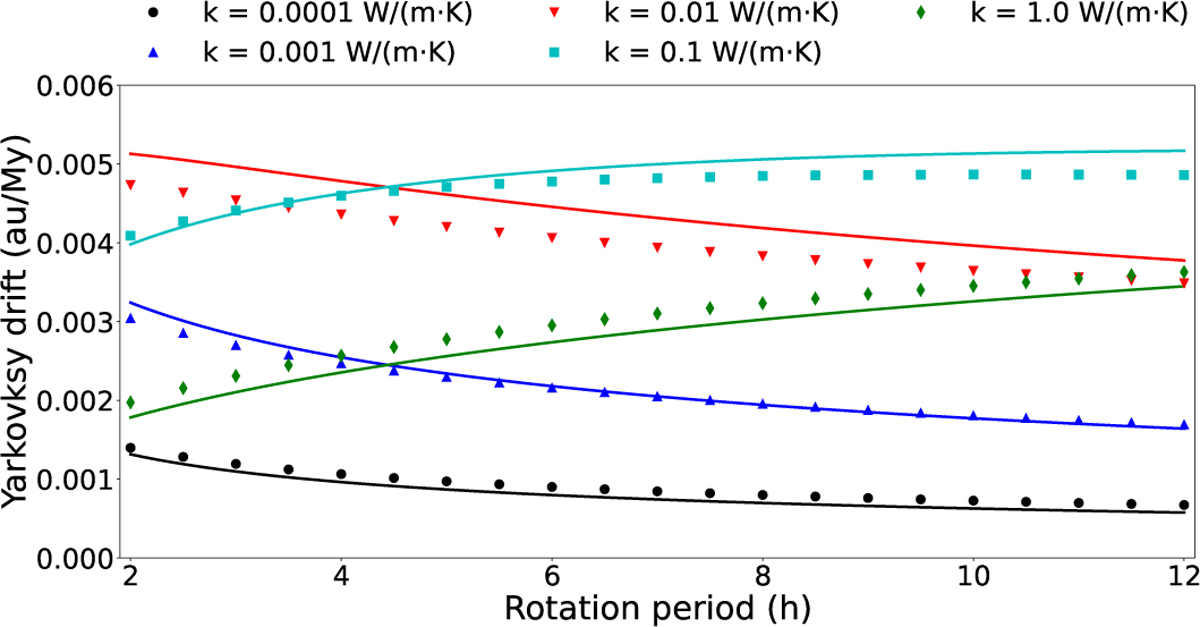
Comparison between analytical solutions (solid lines) and numerical results (dots) for different rotation periods, using a grid resolution of 32 layers and a surface layer thickness of 0.05 ∙ ld. The model was applied to the test asteroid with parameters given in Table 1, but using γ = 30°.
Current usage metrics show cumulative count of Article Views (full-text article views including HTML views, PDF and ePub downloads, according to the available data) and Abstracts Views on Vision4Press platform.
Data correspond to usage on the plateform after 2015. The current usage metrics is available 48-96 hours after online publication and is updated daily on week days.
Initial download of the metrics may take a while.