Fig. 1
Download original image
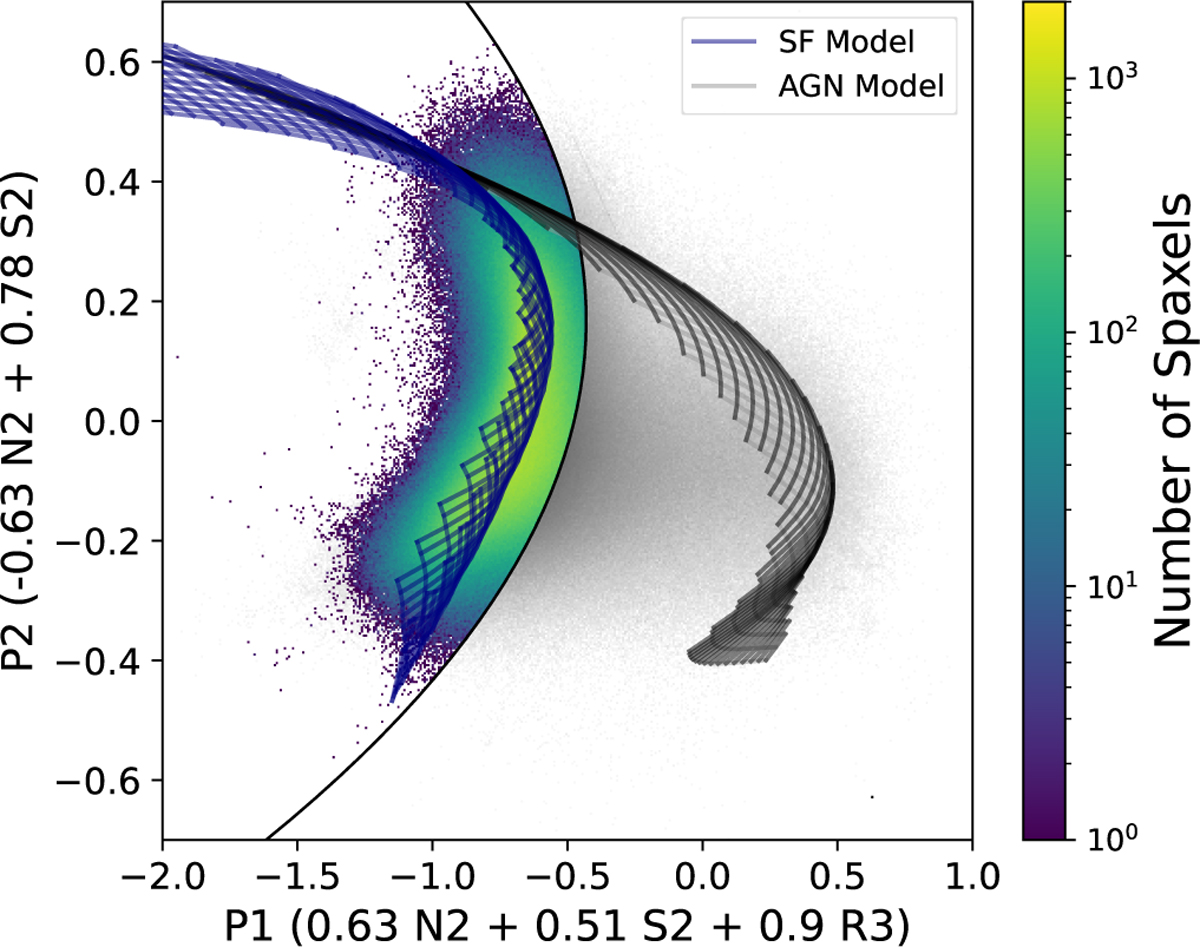
Density distribution of the data (gray) and the selected samples (colored) in refined optical diagnostic (P1–P2) diagram. The blue grids are the photoionization models for SF regions, and the gray grids are the photoionization models for AGNs; each cross corresponds to a unique pair of metallicity and ionization parameter. Both grids are applied a cut so that only the parts that within the middle 98% of the total data along the hidden P3 axis are shown. The definitions of P1 and P2 are in the text. The demarcation line corresponds to fS F = 0.90, which means the maximum contamination to Hα from AGN-ionized regions is 10%.
Current usage metrics show cumulative count of Article Views (full-text article views including HTML views, PDF and ePub downloads, according to the available data) and Abstracts Views on Vision4Press platform.
Data correspond to usage on the plateform after 2015. The current usage metrics is available 48-96 hours after online publication and is updated daily on week days.
Initial download of the metrics may take a while.