Fig. 10
Download original image
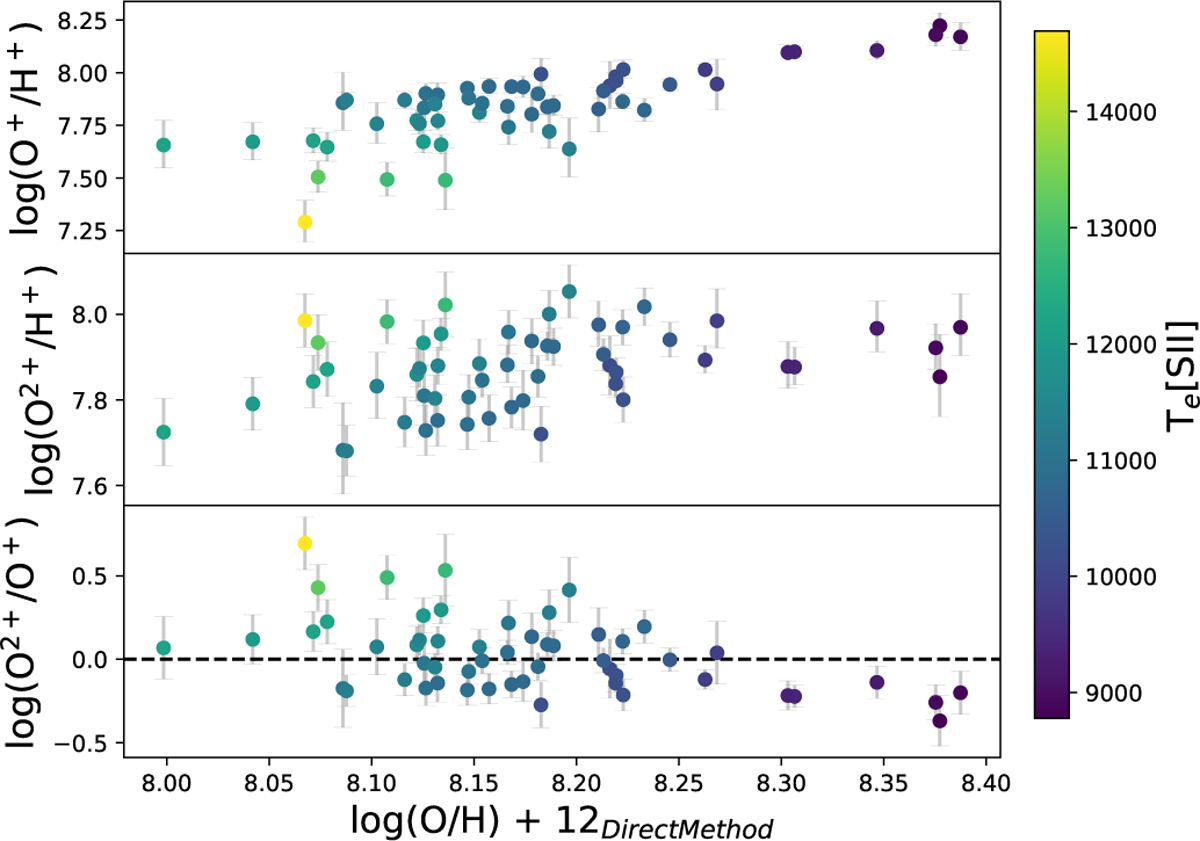
Abundance of O+ (top panel), O2+ (middle panel), and O2+/O+ (bottom panel) versus total abundance. All the abundances are presented in the form of 12+log(abundance). The uncertainties of abundance measurements are illustrated via the gray error bars, and in the bottom panel, the error bars are calculated via error propagation. The dashed line in the bottom panel demonstrates 12 + log(O2+/H) = 12 + log(O+/H). Data points are color-coded by Te [S II].
Current usage metrics show cumulative count of Article Views (full-text article views including HTML views, PDF and ePub downloads, according to the available data) and Abstracts Views on Vision4Press platform.
Data correspond to usage on the plateform after 2015. The current usage metrics is available 48-96 hours after online publication and is updated daily on week days.
Initial download of the metrics may take a while.