Fig. 11
Download original image
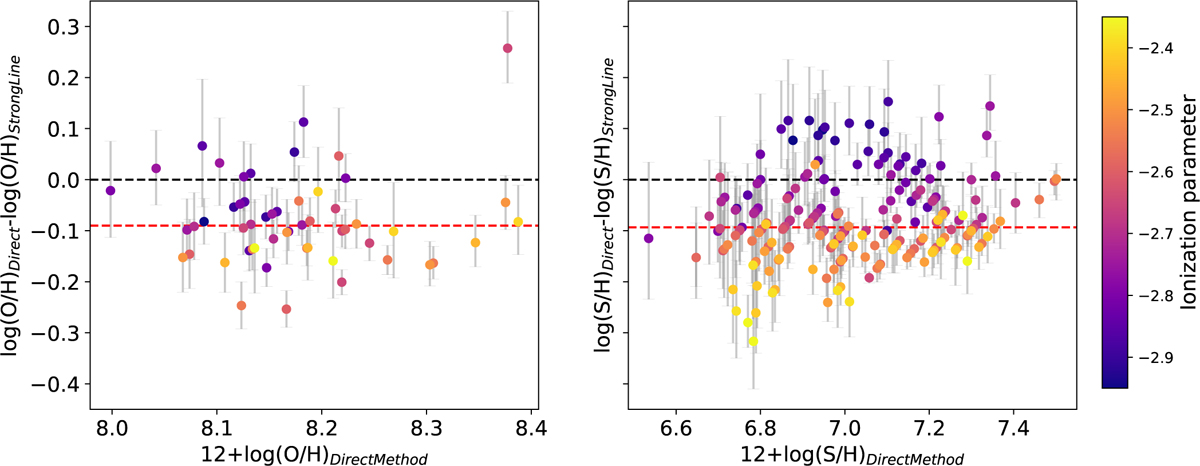
Difference of oxygen (left) and sulfur (right) total abundance derived by the direct method and the theoretical strong-line method versus the total abundance derived by the direct method. The horizontal dashed black lines demonstrate 12 + log(O/H)direct = 12 + log(O/H)StrongLine and 12 + log(S/H)direct = 12 + log(S/H)StrongLine. The horizontal dashed red lines represent the median values of metallicity differences. The gray error bars show the uncertainties of the direct method. Data points are color-coded by the ionization parameters of their bins.
Current usage metrics show cumulative count of Article Views (full-text article views including HTML views, PDF and ePub downloads, according to the available data) and Abstracts Views on Vision4Press platform.
Data correspond to usage on the plateform after 2015. The current usage metrics is available 48-96 hours after online publication and is updated daily on week days.
Initial download of the metrics may take a while.