Fig. 12
Download original image
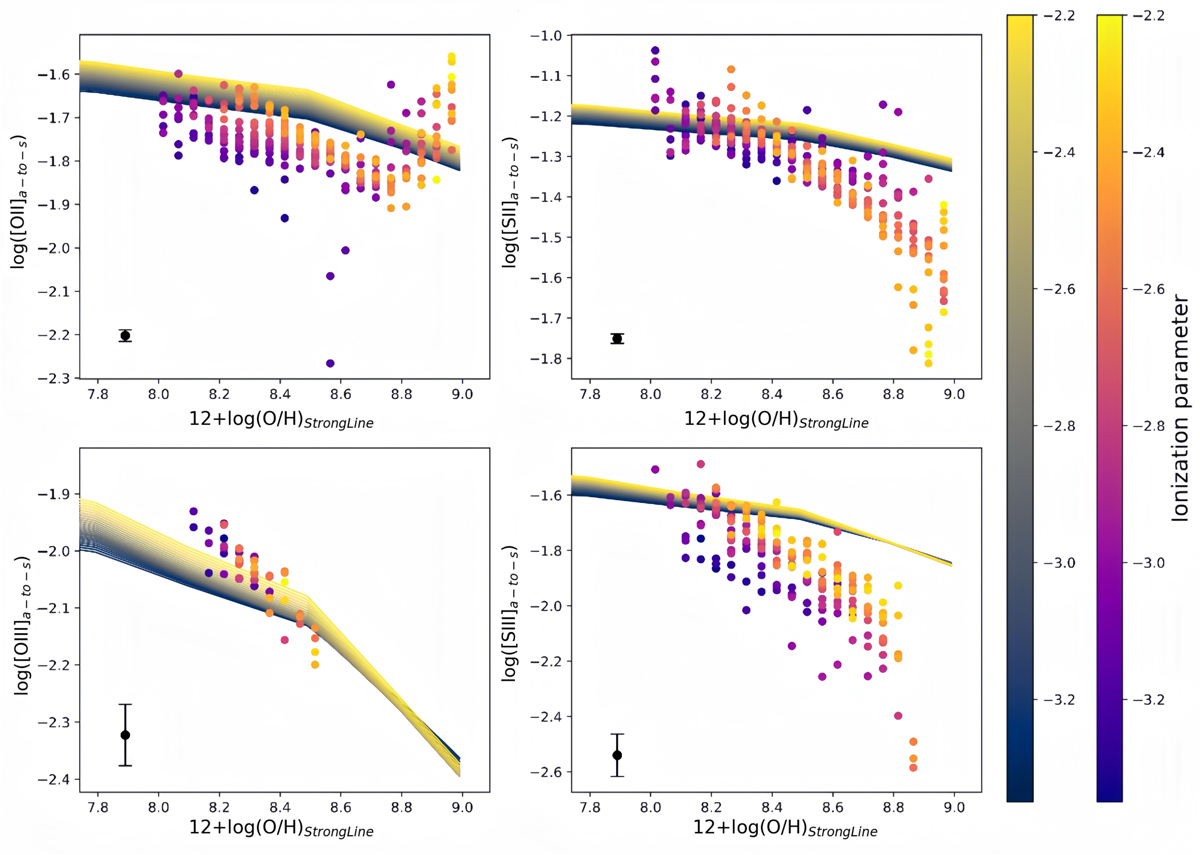
Observed auroral-to-strong line ratios and CLOUDY-generated auroral-to-strong line ratios plotted as functions of binning metallicities for [O II] (upper left), [S II] (upper right), [O III] (lower left), and [S III] (lower right). Lines in the panels represent the data generated by CLOUDY and are color-coded by ionization parameters (the left color bar). Dots in the panels represent the observed data and are also colored by ionization parameters (the right color bar). In the lower left corner of each panel, the black error bar shows the median uncertainty of the observed data. Observed data have a significant offset from the models.
Current usage metrics show cumulative count of Article Views (full-text article views including HTML views, PDF and ePub downloads, according to the available data) and Abstracts Views on Vision4Press platform.
Data correspond to usage on the plateform after 2015. The current usage metrics is available 48-96 hours after online publication and is updated daily on week days.
Initial download of the metrics may take a while.