Fig. 3
Download original image
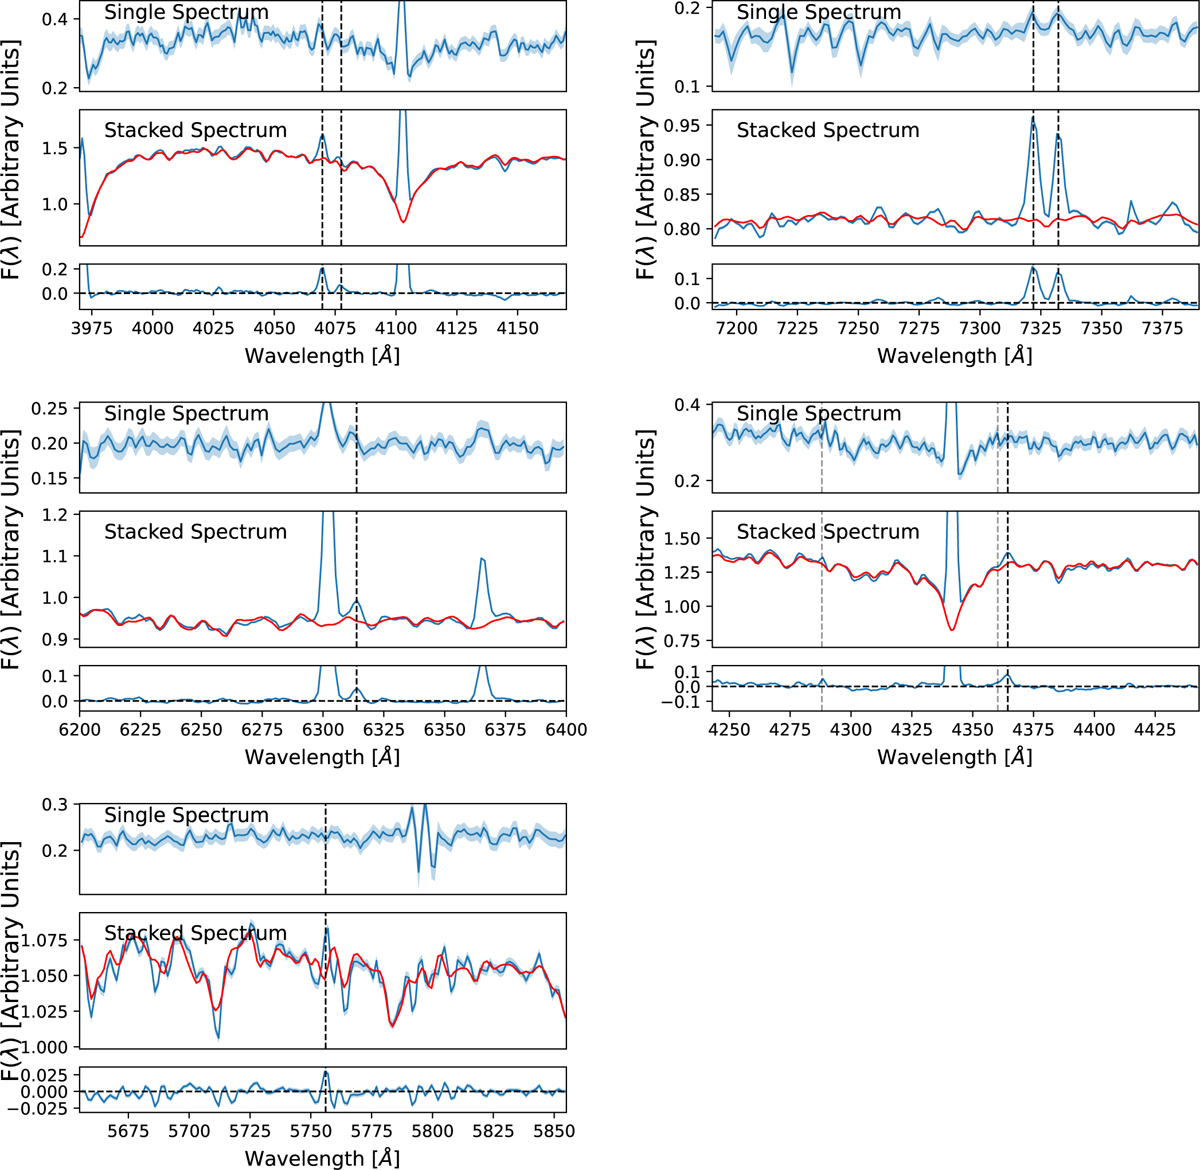
Spectra of [S II] auroral lines (top left), [O II] auroral lines (top right), [S III] auroral line (mid left), [O III] auroral line (mid right), and [N II] auroral line (bottom left) from a sample bin ![]() with 2909 spaxels. In each panel, from top to bottom, the three rows correspond to a single spectrum, the stacked spectrum (blue), as well as the best-fit stellar continuum spectrum(red), and the stacked spectrum after removing the stellar continuum, where the auroral lines can be clearly detected. The shaded regions of the top row represent the uncertainties of flux, taken from MaNGA maps files. The shaded regions of the stacked spectra are errors propagated from individual spaxels. In the [O III] panel, the dashed gray lines represent the [Fe II]λ 4359 (right) and [Fe II] λ 4288 (left).
with 2909 spaxels. In each panel, from top to bottom, the three rows correspond to a single spectrum, the stacked spectrum (blue), as well as the best-fit stellar continuum spectrum(red), and the stacked spectrum after removing the stellar continuum, where the auroral lines can be clearly detected. The shaded regions of the top row represent the uncertainties of flux, taken from MaNGA maps files. The shaded regions of the stacked spectra are errors propagated from individual spaxels. In the [O III] panel, the dashed gray lines represent the [Fe II]λ 4359 (right) and [Fe II] λ 4288 (left).
Current usage metrics show cumulative count of Article Views (full-text article views including HTML views, PDF and ePub downloads, according to the available data) and Abstracts Views on Vision4Press platform.
Data correspond to usage on the plateform after 2015. The current usage metrics is available 48-96 hours after online publication and is updated daily on week days.
Initial download of the metrics may take a while.