Fig. 4
Download original image
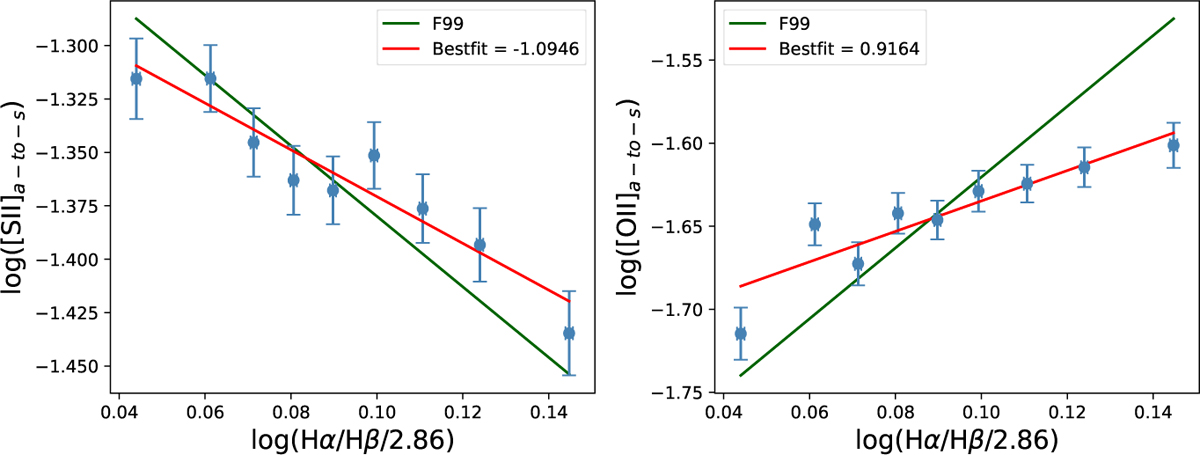
Auroral-to-strong line ratio of [S II] (left) and [O II] (right) versus normalized Balmer decrement (HαHβ2.86) in one randomly chosen metallicity-ionization parameter bin, both in logarithm space. Each data point represents the line ratio of a sub-bin that is constructed by spaxels with similar Balmer decrements. The error bars describe the uncertainties of line ratios. The green line is the F99 correction relation with Rv = 3.1, which is generally steeper than the data distribution. The red line is our fitting for these data points, which considers both the x and y axes uncertainties simultaneously.
Current usage metrics show cumulative count of Article Views (full-text article views including HTML views, PDF and ePub downloads, according to the available data) and Abstracts Views on Vision4Press platform.
Data correspond to usage on the plateform after 2015. The current usage metrics is available 48-96 hours after online publication and is updated daily on week days.
Initial download of the metrics may take a while.