Fig. 5
Download original image
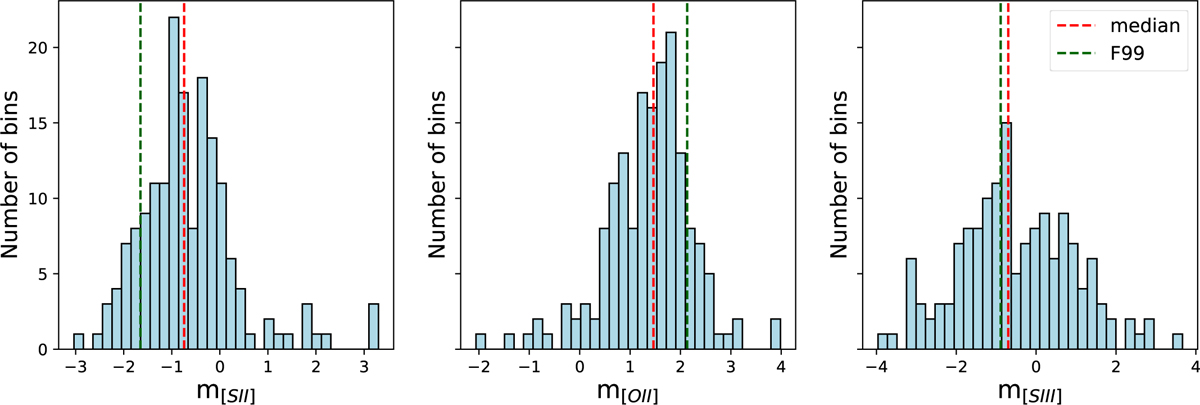
Slopes of relative attenuation distribution in the blue histograms of the linear fitting for [S II] λλ 4069,4076/[S II] λλ 6716,6731 (left) and [O II] λλ 7320,7330/[O II] λλ 3726,3729 (middle), and [S III] λ 6312/[S III] λλ 9068,9531 (right) of all the sub-bins. The green lines represent the slopes of relative attenuation from F99, and the red lines represent the median slopes of 168 bins. The values of median slopes are presented in Table 2.
Current usage metrics show cumulative count of Article Views (full-text article views including HTML views, PDF and ePub downloads, according to the available data) and Abstracts Views on Vision4Press platform.
Data correspond to usage on the plateform after 2015. The current usage metrics is available 48-96 hours after online publication and is updated daily on week days.
Initial download of the metrics may take a while.