Fig. 6
Download original image
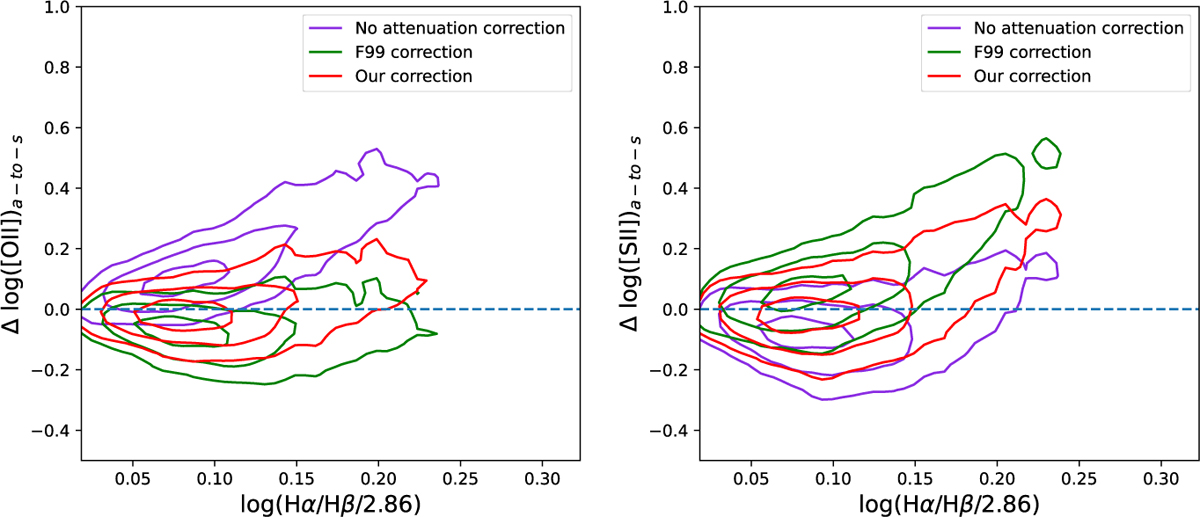
Relation between [O II] (left) and [S II] (right) auroral-to-strong line ratios differences and log(Hα/Hβ) from all the sub-bins, a total number of 1512. The line ratio differences mean the actual auroral-to-strong line ratios minus the intrinsic auroral-to-strong line ratios given by the intercept of the best-fit line in each bin. The purple contours represent the density distribution of data without any correction. The green contours represent data after a F99 correction with RV = 3.1. The red contours represent data after our correcting method described in this section. The contour levels represent 68%, 95%, and 99% of all the data points. The dashed blue lines are horizontal. A horizontal distribution is expected for the correct attenuation correction, as there should be no residual dependence on the Balmer decrement.
Current usage metrics show cumulative count of Article Views (full-text article views including HTML views, PDF and ePub downloads, according to the available data) and Abstracts Views on Vision4Press platform.
Data correspond to usage on the plateform after 2015. The current usage metrics is available 48-96 hours after online publication and is updated daily on week days.
Initial download of the metrics may take a while.