Fig. 8
Download original image
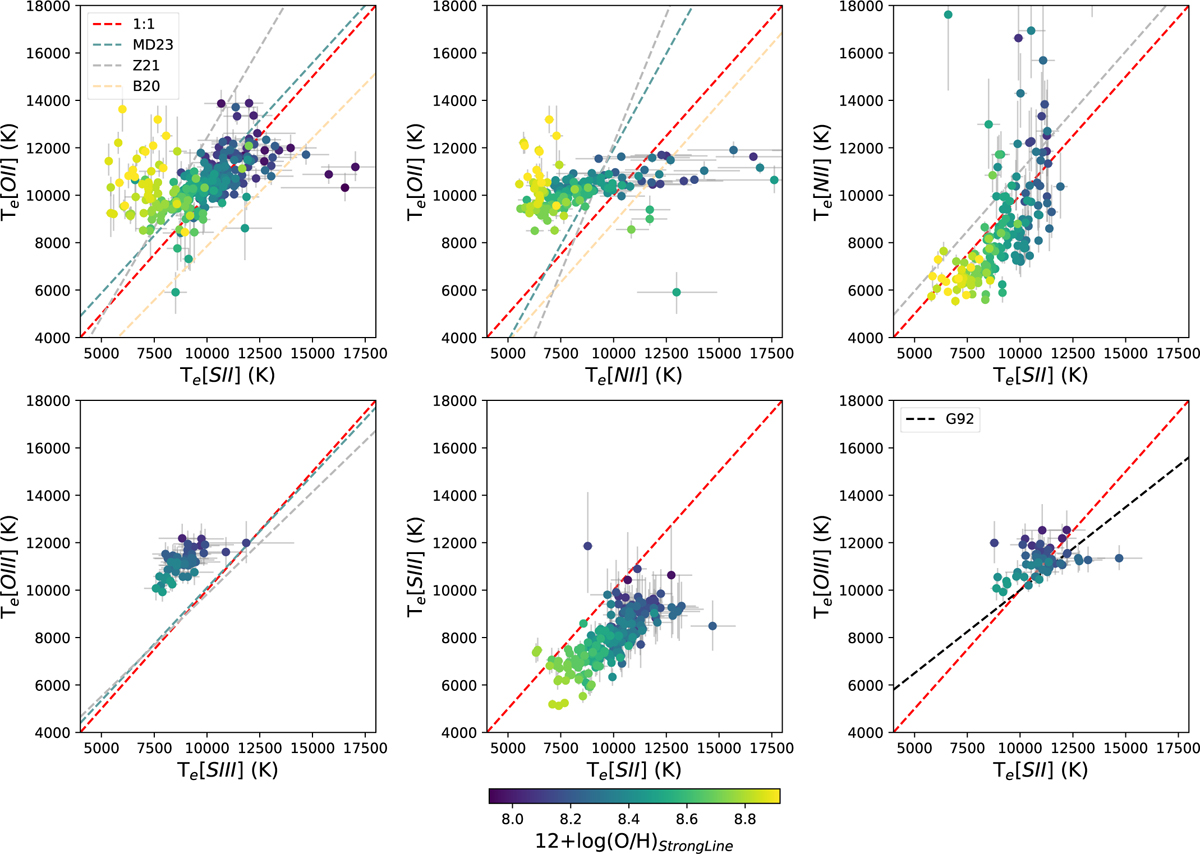
Comparisons between Te derived from [S II], [O II], [N II], [S III], and [O III]. Each dot represents the data from a stacked spectrum of a certain metallicity–ionization parameter bin. The gray error bars correspond to 1 σ uncertainties of the temperature measurements. The dashed red line in each panel shows the 1:1 line. The dashed gray, orange, cyan, and black lines represent previous T–T relations from Zurita et al. (2021) (Z21), Berg et al. (2020) (B20), Méndez-Delgado et al. (2023a) (MD23), and Garnett (1992) (G92). The color of each dot represents its theoretical strong-line metallicity.
Current usage metrics show cumulative count of Article Views (full-text article views including HTML views, PDF and ePub downloads, according to the available data) and Abstracts Views on Vision4Press platform.
Data correspond to usage on the plateform after 2015. The current usage metrics is available 48-96 hours after online publication and is updated daily on week days.
Initial download of the metrics may take a while.