Open Access
Fig. E.1
Download original image
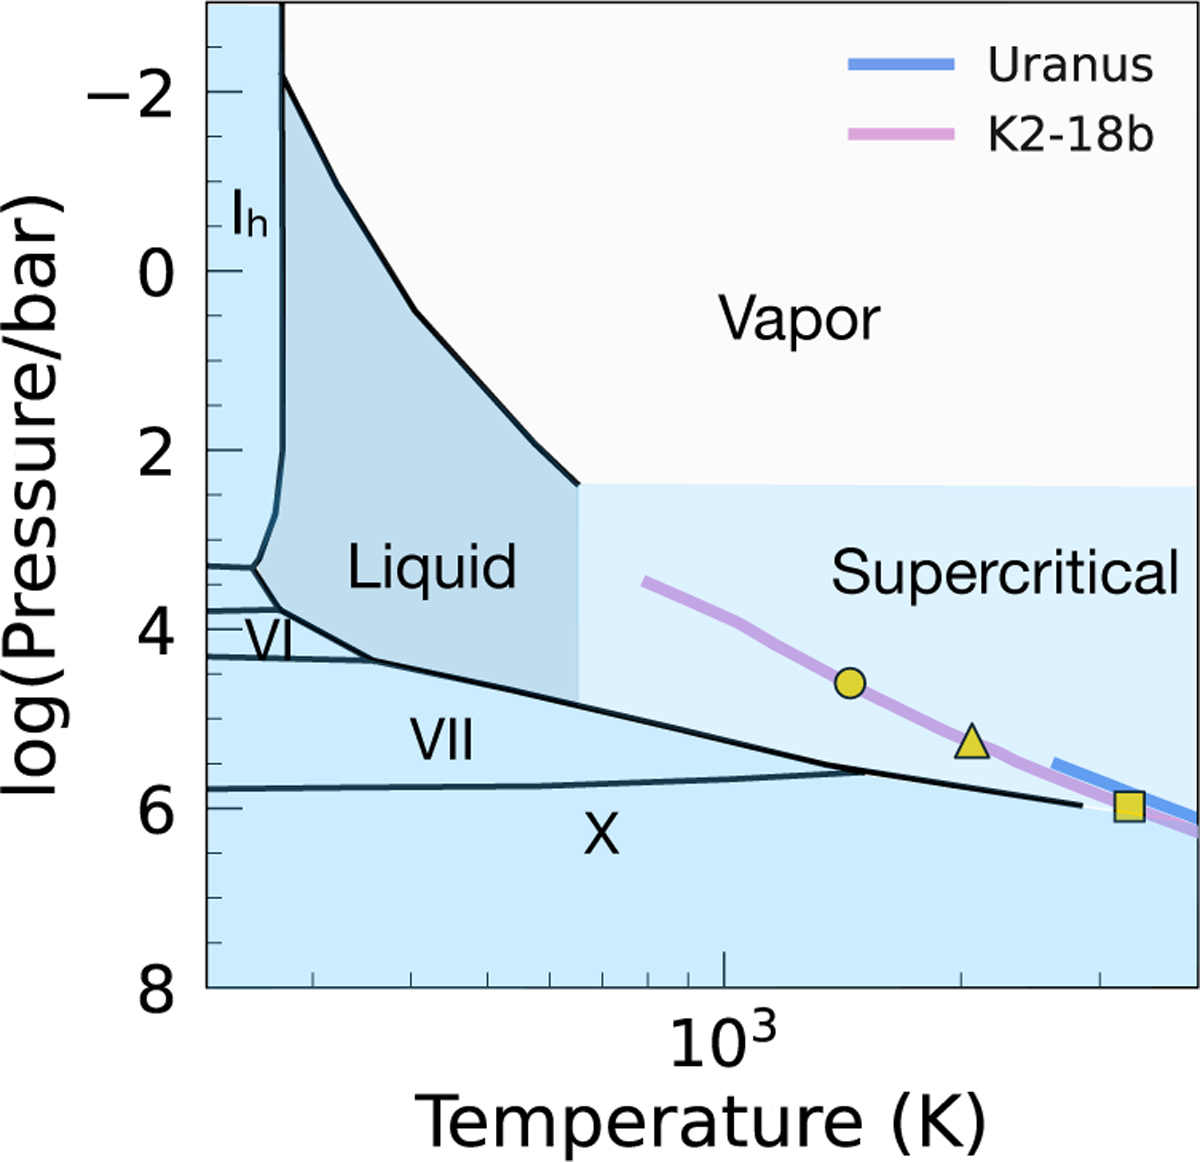
Water phase diagram. The curves for Uranus and K2-18 b show only the portions of the adiabats where water is present. The yellow circle shows the lower bound of the molecular phase from Redmer et al. (2011) while the triangle and square show the expected molecular-to-ionic and ionic-to-superionic transitions in K2-18b.
Current usage metrics show cumulative count of Article Views (full-text article views including HTML views, PDF and ePub downloads, according to the available data) and Abstracts Views on Vision4Press platform.
Data correspond to usage on the plateform after 2015. The current usage metrics is available 48-96 hours after online publication and is updated daily on week days.
Initial download of the metrics may take a while.