| Issue |
A&A
Volume 703, November 2025
|
|
|---|---|---|
| Article Number | A154 | |
| Number of page(s) | 12 | |
| Section | Planets, planetary systems, and small bodies | |
| DOI | https://doi.org/10.1051/0004-6361/202556322 | |
| Published online | 13 November 2025 | |
The possibility of hydrogen-water demixing in Uranus, Neptune, K2-18 b and TOI-270 d
1
Institut für Astrophysik, Universität Zürich,
Winterthurerstr. 190,
CH8057
Zurich,
Switzerland
2
Institut für Physik, Universität Rostock,
18051
Rostock,
Germany
3
SLAC National Accelerator Laboratory,
2575 Sand Hill Road,
Menlo Park,
California
94025,
USA
★ Corresponding author: This email address is being protected from spambots. You need JavaScript enabled to view it.
Received:
8
July
2025
Accepted:
5
October
2025
Abstract
Context. The internal structures of Uranus and Neptune remain unknown. In addition, sub-Neptunes are now thought to be the most common type of exoplanets. Improving our understanding of the physical processes that govern the interiors of such planets is therefore essential. Phase separation between planetary constituents may occur, in particular, hydrogen-water immiscibility in cold, water-rich intermediate-mass planets.
Aims. We assess whether hydrogen-water demixing could occur in Uranus, Neptune, K2-18 b and TOI-270 d, and investigate its effect on the planetary evolution and inferred internal structure.
Methods. We couple planetary evolution models with recent ab initio calculations of the hydrogen-water phase diagram, allowing for temperature shifts to account for uncertainties in miscibility gaps.
Results. We find that demixing may occur and could lead to a complete depletion of water in the outermost regions of Uranus and Neptune. Temperature offsets of up to 1100 K lead to a depleted region comprising as much as 16% of the planet’s mass, and an increase in planetary radius by nearly 20%. For K2-18 b, our models suggest that hydrogen-water demixing is ongoing and may explain the absence of water features in its JWST spectrum. A temperature offset of 500 K is required to get a complete depletion of water in the atmosphere of K2-18b. TOI-270d may also have experienced hydrogen-water demixing. When applying a similar temperature offset on the phase diagram as for K2-18 b, we find a partial depletion of water in the atmosphere of TOI-270 d, consistent with JWST’s detection of water.
Conclusions. Hydrogen-water immiscibility may play a key role in shaping the structure and evolution of both Solar System giant planets like Uranus and Neptune, and cold/temperate exoplanets such as K2-18 b and TOI-270 d. Accounting for such internal processes is crucial to accurately interpret atmospheric observations from current (e.g., JWST) and upcoming (e.g., ARIEL) missions.
Key words: planets and satellites: composition / planets and satellites: gaseous planets / planets and satellites: interiors
© The Authors 2025
 Open Access article, published by EDP Sciences, under the terms of the Creative Commons Attribution License (https://creativecommons.org/licenses/by/4.0), which permits unrestricted use, distribution, and reproduction in any medium, provided the original work is properly cited.
This article is published in open access under the Subscribe to Open model. This email address is being protected from spambots. You need JavaScript enabled to view it. to support open access publication.
1 Introduction
Revealing the internal structure of planets is crucial to understanding their formation pathways. Gravity data typically constrain static interior models of planets in the Solar System whereas for exoplanets we use mass, radius, and, when available, atmospheric composition. Such models provide information about the present-day structure and composition but often assume a priori different layers in the structure. Evolution models provide a complementary perspective as they capture how internal physical processes shape the structure over time and offer insights into the possible existence of distinct layers. Moreover, modeling the thermal evolution is fundamental as it links planetary formation and present-day internal structure.
Key physical processes incorporated in evolution models include convective mixing, which can redistribute materials as planet evolves. This has been integrated into evolution models of Jupiter and Saturn (Vazan et al. 2018; Müller et al. 2020; Bodenheimer et al. 2025), Uranus and Neptune (Vazan & Helled 2020; Arevalo 2025), and gas giant exoplanets (Knierim & Helled 2024). Another relevant process, the rainout of silicate triggered by their condensation, has been investigated in the context of sub-Neptune planets (Vazan & Ormel 2023; Vazan et al. 2024). Furthermore, phase separation between chemical species can drive internal differentiation and significantly impact planetary evolution.
For Jupiter and Saturn, it is now quite established that hydrogen-helium phase separation leads to helium rain, enriching the deep interiors with helium while depleting the outer layers. The pioneering work of Smoluchowski (1967), Salpeter (1973), and Stevenson & Salpeter (1977) allowed recent models (Mankovich & Fortney 2020; Howard et al. 2024) to confirm that helium rain plays a key role in explaining the differences in the internal structures of Jupiter and Saturn.
The phase separation between hydrogen and water could affect the evolution of Uranus and Neptune. Interior models by Bailey & Stevenson (2021) suggested that Uranus may be in a more advanced stage of hydrogen-water demixing than Neptune, implying a current higher water content in Neptune’s atmosphere and potentially explaining the disparity in heat flow between the planets. However, their analysis relied on the extrapolation of immiscibility curves beyond the range of available experimental data (up to 3 GPa) (Seward & Franck 1981; Bali et al. 2013). Recently, Cano Amoros et al. (2024), followed Bailey & Stevenson (2021) and constructed interior models using updated experimental and theoretical data on the hydrogen-water
phase diagram (Bergermann et al. 2021a; Vlasov et al. 2023; Bergermann et al. 2024). However, both Bailey & Stevenson (2021) and Cano Amoros et al. (2024) focused exclusively on static models and did not consider their thermal evolution.
In this paper, we incorporate hydrogen-water demixing into evolution simulations of Uranus and Neptune. Hydrogen-water demixing can occur when planets are sufficiently cold. Exoplanets may also be subject to this phenomenon, provided they lie within an appropriate temperature regime and contain enough water. We therefore also investigate the evolution of the exoplan-ets K2-18b and TOI-270d.
Our paper is organized as follows. Section 2 explains our methods. Section 3 presents our results for Uranus and Neptune, while Sect. 4 presents our results for K2-18b and TOI-270 d. Section 5 discusses the limitations and future improvements of our work. Our conclusions are summarized in Sect. 6.
2 Methods
2.1 Phase diagram
The latest miscibility calculations using a combination of density functional theory and molecular dynamics (DFT-MD) of the mixtures H2 - H2O could reach pressures up to 300 kbar, an order of magnitude higher than the maximal pressure obtained experimentally before (Bergermann et al. 2024). Combining these ab initio simulations with the experimental data from Seward & Franck (1981), Bali et al. (2013), and Vlasov et al. (2023) and the melting line of water, we fitted a Lorentzian-like equation to interpolate the demixing temperatures for a wider range of compositions. The fit formula is discussed in Appendix A. Next, we interpolated the curves over a larger range of pressures. This phase diagram is then coupled with our planetary evolution models. Note that the P − T − x conditions as shown in Fig. 1 are subject to uncertainties: the DFT-MD simulations might suffer from inaccuracies due to the choice of the exchange-correlation functional, while some of the experimental campaigns did not investigate the influence of the water concentration. Nevertheless, Bali et al. (2013) and Vlasov et al. (2023) used a similar experimental setup and found consistent results for most of the P-T conditions.
In the following, we introduce Toffset which shifts the demixing diagram to higher temperatures while keeping the concentration and corresponding pressures constant. This shift is justified by uncertainties in the miscibility gap itself, uncertainties in the equation of state (EOS) (for further discussion see Appendix B), and missing knowledge of the exact planetary composition. Additionally, the shift allows us to investigate the influence of the miscibility gap for a wider range of scenarios.
2.2 Model assumptions
Our planetary evolution models were calculated with CEPAM (Guillot & Morel 1995), which solves the standard structure equations (see, e.g., Helled & Howard 2024). These models build upon our previous work (Howard et al. 2024), which focused on the evolution of Jupiter and Saturn, including hydrogen-helium phase separation. A key difference in the present study is the treatment of the energy equation: we adopt a formulation based on internal energy rather than entropy. This choice ensures the inclusion of a term that accounts for changes in composition (Strittmatter et al. 1970; Morel 1997).
Our evolution models, whether for Uranus, Neptune, or K2-18 b, initially have the following structure: a central core purely made of rocks, surrounded by an envelope consisting of a mixture of H2 He - H2O. This envelope consists of a composition gradient in the water content, while the hydrogen-to-helium ratio is fixed to the protosolar value (Asplund et al. 2021). This structure is roughly consistent with predictions of formation models (Valletta & Helled 2022). Basically, the parameters of our models are the mass of the core (Mcore), the water-mass fraction in the inner and outer regions of the envelope (ZH2O,deep and ZH2O,atm, respectively), and the extent of the water gradient expressed as a normalized mass coordinate (mdilute) (as defined in Howard et al. 2023). The slope of the initial water gradient is defined with δmdil which is fixed to 0.075 in all our models. The temperature gradient in the envelope is assumed to be adiabatic. This assumption is discussed in Sect. 5. Given its higher mean density (2.70 g.cm−3), TOI-270 d is likely to have a more rock-dominated interior. We hence adopt a simpler structure for this planet, which is discussed in Sect. 4.2.
We used the analytical EOS of Hubbard & Marley (1989) to compute the pressure-dependent density in the isothermal rocky core. For hydrogen and helium, we used the CMS19 + HG23 EOS (Chabrier et al. 2019; Howard & Guillot 2023), and for water, we used QEOS (More et al. 1988). Note that more recent water EOSs exist. However, for simplicity, we used QEOS. Moreover, we calculated adiabats using QEOS and compared our findings with the results of (Cano Amoros et al. 2024) obtained using the AQUA1 EOS. The comparison, presented in Appendix B, shows that the temperature difference due to the choice of water EOS ranges from about 500 to 1000 K between tens and 300 kbar. Such differences support the idea of shifting the temperature of the phase diagram.
For Uranus and Neptune, we used the atmospheric grids of Fortney et al. (2011) which were inverted to determine the intrinsic temperature as a function of the temperature at 10 bar and surface gravity. For K2-18b and TOI-270 d, we used the atmospheric model of Guillot (2010), where the intrinsic temperature was calculated from the intrinsic luminosity. The thermal opacity was fixed to κth = 0.01 cm2g−1 and the visible opacity κv was adjusted to yield γ = κv/κrh values that are consistent with those tabulated by Jin et al. (2014) for the corresponding equilibrium temperatures. The equilibrium temperatures for Uranus, Neptune, K2-18b and TOI-270 d are set to 58.1, 46.4, 254 and 354 K, respectively.
The demixing procedure used in this work follows the approach described in Howard et al. (2024), itself inspired by previous studies (Nettelmann et al. 2015; Mankovich et al. 2016), and has been adapted here for the demixing of H2 - H2O. This accounts for the presence of helium as our models feature ternary mixtures (H2 - He - H2O) while the used phase diagram provides mass fractions corresponding to a binary mixture. We briefly summarize the procedure (further details can be found in Howard et al. (2024). As the planet cools, its p-T profile may intersect the immiscibility region of the H2 and H2O phase diagram. In the region of the planet where phase separation occurs, water droplets form and sink. Hence, such a region is depleted in water until it reaches saturation, that is, a new equilibrium composition where no further separation takes place. As the planet continues to cool, there might be a new equilibrium abundance, leading to further water depletion. In addition, the upper layers become progressively depleted, as convective mixing transports water downward to the region below the phase separation. Subsequently, the water is redistributed downwards, enriching the deeper layers. It is initially deposited in the layer directly beneath the region undergoing phase separation.
Since our models feature an initial compositional gradient in water, and to ensure that the water distribution remains monotonic with depth, we apply an iterative procedure as follows: if the layer directly beneath the region that undergoes phase separation has a higher water abundance than the subsequent deeper layer, the excess water is redistributed uniformly among them. This process is then repeated successively with deeper layers until a monotonic water profile is achieved.
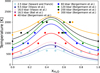 |
Fig. 1 Miscibility gap of hydrogen and water for different temperatures (color-coded). DFT-MD simulations by (Bergermann et al. 2024) are shown as colored circles while earlier experimental campaigns of Seward & Franck (1981), Bali et al. (2013), and Vlasov et al. (2023) are presented by colored diamonds and traingles, respectively. |
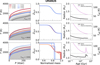 |
Fig. 2 Evolution models of Uranus. Each row shows results for a different temperature offset applied to the hydrogen-water phase diagram (Toffset = 0, 600 or 1000 K.) Left panels : temperature-pressure profiles at different ages. Phase curves are shown with grey to black lines for water mass fractions of 0.92 to 0. Grey-shaded areas mark demixing regions. Center panels : water mass fraction as a function of normalized mass, colored by age. Right panels : radius and effective temperature as a function of age. The horizontal dashed lines show the measured values. |
3 Application to Uranus and Neptune
3.1 Uranus
For Uranus, we present three evolution models to explore the effects of hydrogen-water demixing. Given the uncertainties in both the hydrogen-water phase diagram and the planet’s temperature-pressure profile partly due to limitations in the water EOS, we allow for a temperature offset on the phase diagram. These three models correspond to different temperature offsets, i.e. Toffset = 0, 600 or 1100 K. The objective of the analysis is to assess the effect of hydrogen-water demixing, should it occur in the interior of the planet. Therefore, we did not conduct an extensive parameter study and did not aim to find the best Uranus model. Instead, we assess how materials are redistributed due to hydrogen-water demixing and investigate how the planetary radius and the temperature structure are affected.
Figure 2 shows the results for Uranus. The top row corresponds to the case with Toffset = 0, i.e. with the original phase diagram (depicted with grey to black lines). We find that even after 5 Gyr of evolution, Uranus’ adiabat is still too warm to intersect with demixing curves that correspond to water mass fractions lower than those present in Uranus. Therefore, no hydrogen-water demixing occurs and the initial water profile remains unchanged throughout the entire evolution. This model fits the observed mean radius and effective temperature because the parameters were optimized for that, using a Monte-Carlo method (see Müller & Helled 2023). The parameters of the model are: Mcore = 4 Me, mdilute = 0.8, ZH2O,deep = 0.88 and ZH2O,atm = 0.4.
The middle row shows the results for Toffset = 600 K. In this case, Uranus’ adiabat cools sufficiently to experience hydrogenwater demixing. After 2 Gyr, demixing begins but only in the outermost region of the planet, at pressures below 2.4 kbar. This represents only a few percent of the planet’s mass. The abundance of water ZH2O,atm abruptly drops to zero. The relatively small amount of water removed in the outer regions and redistributed deeper affects the planetary radius. At ~2 Gyr, the radius slightly increases (by 3%) driven by the release of energy due to demixing. This radius inflation was already predicted in Bailey & Stevenson (2021), as well as in Vazan et al. (2024) who studied the settlement of silicates. We note that adjusting the initial parameters to yield a denser structure would allow the model to match the observed radius at the end of the evolution. A comparison of this model with one using another form of the equation of conservation of energy is presented in Appendix C.1.
Lastly, we present a case where Toffset = 1100 K, in which Uranus has “fully crossed” the hydrogen-water phase diagram. Increasing the temperature offset causes the demixing process to occur earlier. The onset of demixing found at ~2 Gyr for Toffset = 600 K now occurs at 500 Myr. A similar decrease of ZH2O,atm to 0 and an increase of the planetary radius is found. As the planet continues to evolve, a progressively larger outer portion of the planet is being depleted in water. At about 3 Gyr, Uranus’ adiabat intersects with the hydrogen-water phase diagram such that the outer 15% of the planet by mass undergo demixing. Because only a few percent were affected previously, this now results in a substantial radius increase of 20%. The effective temperature is also significantly affected and increases by 43%. The bottom left panel shows that Uranus’ adiabat heats up to temperatures even higher than at earlier times. This increase is caused by energy deposition associated with the water rainout (see Appendix C.2 for details). Eventually, Uranus becomes fully demixed and its water structure becomes differentiated, leaving an outer region (corresponding to the outer 16% in mass) completely depleted in water, and an inner region enriched in water, where ZH2O,deep is close to 1.
Finally, as shown in Appendix D, the redistribution of material due to hydrogen-water demixing significantly affects the calculated gravitational moments (J2 can typically be affected by the order of ~1000 ppm). Furthermore, it was shown that static models with ZH2O,atm ~ 0 can fit the observed gravity field (Nettelmann et al. 2013; Morf et al. 2024). Models with such abundance in atmospheric water are also part of the range of solutions found by Bailey & Stevenson (2021). However, Cano Amoros et al. (2024) find a lower limit of 0.05, although the region where phase separation occurs (between 40 and 110 kbar) is in line with what we obtain.
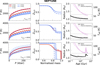 |
Fig. 3 Evolution models of Neptune. Description is same as for Fig. 2. For comparison, Uranus models are shown with dashed lines. |
3.2 Comparison with Neptune
For Neptune, we also present three evolution models, using the same temperature offsets as for Uranus. The only modification is an adjustment of the initial water mass fraction in the outer envelope, which we set to ZH2O,atm = 0.5 instead of 0.4. This change allows the model with Toffset = 0 to reproduce Neptune’s observed radius, which is slightly smaller than that of Uranus. Aside from this adjustment, the parameterization remains similar to that used for Uranus.
In the case with Toffset = 0, no hydrogen-water demixing occurs, as with Uranus (see Fig. 3). The model matches Neptune’s observed radius. However, the resulting effective temperature is 11% lower than the observed value. A dedicated parameter study would be required to identify models that accurately reproduce both the radius and effective temperature. We find that Neptune’s interior is cooler than that of Uranus at the end of the evolution, which is expected due to the lower outer boundary temperature and the assumption of a similar compositional setup with an adiabatic temperature gradient. Under these comparable conditions, we anticipate that Neptune may be at a more advanced stage of hydrogen-water demixing.
When using Toffset = 600 K, demixing occurs and is more pronounced in Neptune than in Uranus, owing to its colder temperature-pressure profile. As with Uranus, the outermost layers - representing only a few percent of the planet’s mass -become fully depleted in water. Additionally, the primordial water gradient begins to erode due to the demixing process. Indeed, the outer 13% of the planet by mass (initially with ZH2O,atm = 0.5) experiences water depletion, slightly decreasing to ZH2O,atm = 0.44. Nevertheless, the resulting increase in planetary radius remains comparable to that of Uranus.
Using Toffset = 1100 K leads to a fully demixed Neptune, as also inferred for Uranus. The associated increases in planetary radius and effective temperature are of similar magnitude between the two planets. The main distinction lies in the extent of the completely depleted region in water: the outer layer where ZH2O,atm = 0 comprises 13% of the Neptune mass, compared to 16% for Uranus.
Here, we compare evolution models of Uranus and Neptune using similarly shifted hydrogen-water phase diagrams. We found that Neptune’s interior is colder than that of Uranus, which naturally arises from its lower equilibrium temperature and the assumption of broadly similar internal structures. Under these conditions, Neptune is expected to be at a more advanced stage of demixing for a given immiscibility diagram. This may be consistent with the results by Cano Amoros et al. (2024) finding ZH2O,atm ranging from 0.05 and 0.21 for Uranus and between 0.05 and 0.16 for Neptune. However, Bailey & Stevenson (2021) suggested the opposite trend based on the significant difference in intrinsic heat flux between the two planets. Indeed, the ratio of total emitted to absorbed solar power is low for Uranus, compared to Neptune (and Jupiter and Saturn) (Irwin et al. 2025; Wang et al. 2025). Our simple comparison does not resolve the long-standing debate about this heat flux disparity. It is possible that Uranus and Neptune differ since or due to the formation, with variations in their bulk composition and structure (such as core mass or compositional gradients) and distinct thermal structures, which could lead to different effects of convective mixing. These differences may significantly influence their internal temperature profiles and, consequently, the degree and characteristics of hydrogen-water demixing within each planet. Nevertheless, Neptune’s outer envelope could still be fully depleted in water, similar to Uranus. Such a scenario would require an enrichment in other volatiles to be consistent with static models that suggest a higher heavy-element content in Neptune’s envelope compared to that of Uranus, and the observed heat flux disparity to be primarily attributed to differences in convective mixing rather than demixing alone.
4 Application to exoplanets
4.1 K2-18b
K2-18b has recently gained interest due to its potential habitability, sparking ongoing discussions (Madhusudhan et al. 2020, 2023; Shorttle et al. 2024; Wogan et al. 2024; Schmidt et al. 2025; Madhusudhan et al. 2025; Taylor 2025; Welbanks et al. 2025; Pica-Ciamarra et al. 2025; Luque et al. 2025). Below, we show that this planet can also undergo hydrogen-water demixing. With a mass of 8.63 ± 1.35 M⊕ (Cloutier et al. 2019) and a radius of 2.61 ± 0.09 R⊕ (Benneke et al. 2019), K2-18b has an equilibrium temperature of 254 K. Moreover, its mean density (2.67 g.cm−3) which is more than twice that of Uranus, suggests that the interior is more enriched with heavy elements. A higher heavy-element content leads to colder adiabats, as illustrated by the comparison between adiabats with ZH2O = 0.4 and 0.8 in Fig. B.1.
Observations from the Hubble Space Telescope (HST) suggested the presence of H2o in the atmosphere of K2-18 b (Madhusudhan et al. 2020). However, the James Webb Space Telescope (JWST) did not detect water (Madhusudhan et al. 2023; Schmidt et al. 2025), which was attributed to condensation and cold trapping. Here, we show that the absence of water could be due to hydrogen-water demixing.
Various scenarios have been proposed for the internal structure of K2-18b. Madhusudhan et al. (2020) initially suggested three of them: a rocky world, a water world, and a miniNeptune. Photochemical and climate considerations have been put forward to try to distinguish the different scenarios. Whereas Madhusudhan et al. (2023) favour the water (or hycean) world interpretation, other studies (Shorttle et al. 2024; Wogan et al. 2024; Schmidt et al. 2025) suggest that a simpler mini-Neptune structure is sufficient to explain the observations. Here, we only consider radius, mass, age, and equilibrium temperature as constraints of our evolution models. The question of habitability is not the focus of our work. Our primary objective is to investigate the potential occurrence of hydrogen-water demixing in a planet like K2-18 b. However, we include a water phase diagram to assess whether liquid water could be present in Appendix E.
We first consider the rocky world scenario. We model the interior with a rocky core that represents 94% of the planetary mass, overlaid by a H-He envelope that represents 6% of the mass. As shown in Fig. 4, we find that this model fits the observed radius, and it is perfectly in line with the rocky world model from Madhusudhan et al. (2020) as well as the “ice-poor” case from Schmidt et al. (2025).
We then consider the water-world scenario. Our model is only made of water (where ZH2O ~ 1), with a minimal H-He atmosphere that represents 10−6 of the planetary mass, as in Madhusudhan et al. (2020). However, such a model yields a radius that is higher than the observed value. Note that we do not exclude the water-world scenario as the inferred radius depends on the considered material and its given EOS (see e.g., Valencia et al. 2013; Howard et al. 2025). A denser water EOS (such as AQUA for instance) could help fit the observed radius.
Finally, we consider the mini-Neptune scenario. We calculated two models: with and without hydrogen-water demixing. Without demixing, we model the planet with a core that represents 37% of the planetary mass. We chose ZH2O,atm = 0.9, ZH2O,deep = 0.99 and mdilute = 0.9. Such parameters allow to fit the observed radius. In this model, H-He represents less than 2% of the mass and water is about 60%. Such a model is included in the range of solutions proposed by Madhusudhan et al. (2020) and Schmidt et al. (2025). Next, we consider hydrogen-water demixing. We chose Toffset = 500 K, which is the minimum temperature offset required to fully deplete the planet’s atmosphere in water. We present one model fitting the observed radius. The core represents 60% of the planetary mass and the assumed parameters are ZH2O,atm = 0.8, ZH2O,deep = 0.95 and mdilute = 0.9. Since demixing is expected to increase the planet’s radius, this set of parameters allowed to make the planet denser compared to the case without demixing and hence helped to fit the observed radius. In this particular model, we found demixing starting after 400 Myr. At the planet’s current age (2.4 Gyr), the outer region of the planet (P < 2.8 kbar) is fully depleted in water. As differentiation is still ongoing, we find a region where ZH2O = 0.7, between 6 and 281 kbar. At higher pressures, the water mass fraction reaches 0.99. This mini-Neptune scenario including hydrogenwater demixing demonstrates that such a phenomenon can lead to significant depletion of water in the outer regions, potentially explaining the non-detection of H2O in JWST observations of K2-18 b’s atmosphere. We emphasize that this is only one model including demixing. We have not conducted a full exploration of the parameter space; our aim is simply to test the plausibility of hydrogen-water demixing as a mechanism that could reconcile internal structure modeling with atmospheric observations. Alternative solutions could certainly exist, and we hope to investigate them in future research.
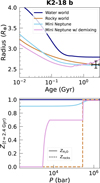 |
Fig. 4 Evolution models of K2-18b. Top panel : planetary radius as a function of age. The black errorbar corresponds to the measured radius and age. Bottom panel : heavy-element mass fraction at 2.4 Gyr (the planet’s age) as a function of pressure. We note that condensation was not considered in our models, which explains why some models have a high heavy-element mass fraction at low pressures. |
4.2 Comparison with TOI-270 d
With a mass of 4.78 ± 0.43 M⊕ and a radius of 2.133 ± 0.058 R⊕ (Van Eylen et al. 2021), TOI-270 d is a temperate sub-Neptune (Teq = 354 K) that also gained interest. Recently, Benneke et al. (2024) suggested that, due to its slightly higher equilibrium temperature and lower mass compared to K2-18 b, TOI-270 d is less likely to be a hycean world. The inferred interior structure was found to consist of a rock/iron core that represents 90% of the planet’s mass, overlaid by an envelope with a heavy-element mass fraction of  (as indicated by JWST).
First, we do not consider hydrogen-water demixing and calculate a similar rock-dominated model, assuming a core that accounts for 90% the planet’s mass and an envelope with  . Given the uncertainty in the planet’s age, we adopt an age range of 1 to 10 Gyr, as done in Benneke et al. (2024). We find that this model can reproduce the observed radius (see Fig. 5). Second, we include the possibility of demixing, using the same temperature offset of Toffset = 500 K as for K2-18 b. In this case, demixing occurs but does not fully deplete the planet’s atmosphere of water. The planetary radius increases by 1.5% due to demixing but remains consistent with the observational constraints. Zatm is reduced from 0.58 to 0.39. It is not in line with the observed value of the total atmospheric metal mass faction. Nevertheless, it is consistent with the upper bound of the water mass fraction that we estimate by considering only the water contribution and accounting for the uncertainties in oxygen and carbon observed abundances. However, the atmospheric heavyelement mass fraction measured by JWST includes other ices (e.g., CH4, CO2) whereas our models consider only H2O. Future models that distinguish different types of ices would be valuable (see Sect. 5). However, this model shows that hydrogen-water demixing could occur and affect the evolution of TOI-270 d.
Figure 6 compares the P-T profiles of the envelopes of TOI-270 d (between 1 and 10 Gyr) and K2-18b (between 500 Myr and 2.4 Gyr). We note that the temperature profile of TOI-270 d does not evolve after 1 Gyr as it stopped cooling. This can be attributed to the presence of a large core, which quickens the cooling of the planetary envelope. This also explains why the radius evolution flattens (Fig. 5). The inset of Fig. 6 shows the sensitivity of our results to the low-pressure part (a few kbars) of the phase diagram (see Sect. 5 for further details). The T-P profiles of K2-18 b are sufficiently cold to intersect the demixing curve that corresponds to a water mass fraction of 0. However, this is not the case for TOI-270 d, and as a result, its outer envelope is not completely depleted in water. It is clear that other models may be possible for TOI-270 d and we hope to address this in future research.
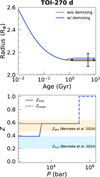 |
Fig. 5 Evolution models of TOI-270d. Top panel : planetary radius as a function of age. The black errorbar corresponds to the measured radius and age. Since the age is uncertain, we adopted an age range of 1 to 10 Gyr. Bottom panel: heavy-element mass fraction at the end of the evolution as a function of pressure. The orange and blue shaded areas show the observed atmospheric metal and water mass fractions, respectively (from Benneke et al. 2024). |
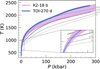 |
Fig. 6 Temperature-pressure profiles of the envelopes of K2-18b and TOI-270 d. A range of profiles between 500 Myr and 2.4 Gyr is shown for K2-18 b while a range between 1 and 10 Gyr is shown for TOI-270 d. Phase curves for different water mass fractions are shown with grey to black lines. |
5 Discussion
Our results are based on several assumptions, some of which warrant further discussion. In this section, we discuss the limitations of our approach, highlight important aspects that merit further investigation, and propose potential improvements of the models presented here.
Shifting the phase diagram. In our models, we considered a temperature shift in the hydrogen-water phase diagram by applying an offset. An offset is possible given the uncertainties in the phase diagram. An additional motivation for applying such a shift is that the water EOS used here predicts lower densities compared to more recent models. Nevertheless, one may question whether applying a constant offset to the entire phase diagram is a valid approach. The low-pressure regime (at a few kbar) of the phase diagram - and similarly of the EOS - may be better known than the high-pressure regime. Since demixing begins in the outer layers of the planet, our results could be biased by applying the same shift to the whole phase diagram. However, in our Uranus model with Toffset = 600 K (Fig. 2), demixing occurs at pressures below 2.4 kbar where temperature differences of 100-400 K still arise due to uncertainties in the water EOS (see Appendix B). Therefore, applying a temperature offset in the low-pressure regime is not unreasonable.
Once the planet has fully crossed the phase diagram, the low-pressure region becomes less critical, as the adiabat intersects the demixing curves at higher pressures as well. This still results in depletion of the outer layers, as assumed in our demixing procedure. However, if demixing is still ongoing, then the low-pressure part of the phase diagram remains important, as do the planetary T-P profiles. Further calculations of the hydrogenwater phase diagram would therefore be valuable. Improving our knowledge of planetary T-P profiles would benefit from better constraints on composition and EOSs. In addition, other processes such as condensation, discussed later, may influence the thermal structure and should be investigated more in depth.
Concerning the phase diagram, the calculations from Bergermann et al. (2024) reach up to 300 kbar. One may wonder what should happen at higher pressures. We considered this value as the upper limit of the phase diagram. Similarly to hydrogen and helium mixtures, we can expect hydrogen and water to be immiscible once one of the constituents becomes solid. This immiscibility could occur as soon as the phase transition from liquid to superionic water occurs (Gupta et al. 2025).
Initial composition. Our evolutionary models account for primordial composition gradients, representing a step beyond previous approaches. Formation models of Uranus and Neptune (Valletta & Helled 2020, 2022) as well as models of miniNeptunes (Ormel et al. 2021) suggest that such gradients are expected. Some interior models of Uranus that fit the measured gravity field also include such gradients (Neuenschwander & Helled 2022; Neuenschwander et al. 2024; Morf et al. 2024; Lin et al. 2025). In this study, the initial composition profiles were chosen arbitrarily, primarily to be consistent with the observed radius. We did not conduct a comprehensive parameter study, and, undoubtedly, alternative solutions are possible. Future work should explore the extent and slope of the water gradient, as well as the initial deep and atmospheric water abundances. In particular, since we found that the abrupt drop of ZH2O,atm to 0 affects the planetary evolution, higher initial atmospheric water abundances could have an even greater effect. In our models, water was the only ice component considered. Including other components such as methane and ammonia could influence the miscibility gap of hydrogen and water. Additionally, we did not mix rocks and water, but assumed that the rocks are concentrated in a central core. In reality, rocks and ices could mix (Vazan et al. 2022). and this should be considered in future models. Moreover, phase separations other than between hydrogen and water should also be considered (e.g., H-He (Lorenzen et al. 2009, 2011; Morales et al. 2013; Schöttler & Redmer 2018a,b; Brygoo et al. 2021; Bergermann et al. 2021b), C-N-O (Militzer 2024) but also C-H (Cheng et al. 2023) or C-H-O He et al. (2022). Future studies exploring the parameter space would be valuable to identify models that can reproduce the observational constraints, particularly after accounting for the radius inflation caused by demixing.
Temperature gradient. In our models, we assumed an adiabatic temperature gradient throughout the envelope. However, the presence of composition gradients implies that the temperature gradient may deviate from adiabatic, though the degree of superadiabaticity remains uncertain. If the deviation is small, the adiabatic assumption might still be a reasonable approximation. To assess the potential impact, we ran a Uranus model (where Toffset = 600 K, similar to the one presented in Sect. 3.1) but assuming a super-adiabatic temperature gradient at the location of the primordial water gradient. We employ the parameterization used in Nettelmann et al. (2015), Mankovich & Fortney (2020), and Howard et al. (2024):
 (1)
(1)
where  and
and  . We used Rρ = 0.01 yielding a central temperature hotter by 1500 K. The departure of the T-P profiles from adiabatic ones are shown in Appendix F. We do not find a significant impact of the super-adiabatic gradient on the occurrence of demixing, nor on its effects on the planetary radius or effective temperature evolution. However, this result depends on the assumed value of Rρ and on the characteristics of the water gradient. In our model, the water gradient is located at pressures higher than those where phase separation occurs, which may limit its influence on the demixing process. In addition, previous evolution models of Uranus and Neptune have suggested that neither planet is fully adiabatic (Nettelmann et al. 2016; Scheibe et al. 2019, 2021). Future studies should explore the parameter space of the temperature gradient - not only at the location of the primordial water gradient but also in the region undergoing phase separation - in order to better constrain its effect on the planetary evolution.
Condensation. Our models do not consider condensation of water or other volatile species. Nevertheless, condensation remains a plausible explanation for the absence of detectable water in observed atmospheres. Studies of the atmospheric dynamics and cloud formation (e.g., Charnay et al. 2021) are essential to assess the role of condensation in shaping the thermal and compositional structure. Condensation could also inhibit convection, as discussed in Guillot (1995), Leconte et al. (2017), and Markham & Stevenson (2021), and affect the temperature gradient in the planetary interior. This could, in turn, change the effect of hydrogen-water demixing on the evolution. Moreover, if condensation inhibits convection, it could hinder mixing and lead to a decoupling between the atmosphere and the outer envelope. In that case, the observable water content in the atmosphere may not be representative of the outer envelope. Future work should explore how clouds influence the atmosphere-interior connection and planetary evolution.
6 Conclusion
In this study, we coupled a planetary evolution model with recent ab initio calculations of the hydrogen-water phase diagram (Bergermann et al. 2024). We allowed for temperature shifts to account for uncertainties in miscibility gaps, and modelled the thermal evolution of Uranus, Neptune, K2-18b and TOI-270 d including hydrogen-water demixing. We found that demixing could occur in their interiors and significantly affect their evolution and internal structure. Fig. 7 shows the inferred interiors of the planets if hydrogen-water demixing occurs. Our main results can be summarized as follows:
Hydrogen-water demixing may occur and could fully deplete the outermost region of Uranus and Neptune in water. Applying temperature offsets on the phase diagram of 600 or 1100 K, we find that this outermost region would represent either a few percent of the planet’s mass or up to 16%. It leads to an increase in the planetary radius by 3 and 20%, respectively.
Hydrogen-water demixing could occur in K2-18 b. This process might explain why the JWST did not detect water in its atmosphere. A mini-Neptune scenario considering this phenomenon can fit the observed radius, mass, age, and equilibrium temperature. A temperature offset of 500 K is required to completely deplete the water in the atmosphere of K2-18b.
TOI-270 d could also have experienced hydrogen-water demixing. When applying a similar temperature offset on the phase diagram as for K2-18b, we find a depletion of water in the atmosphere of TOI-270 d but not a complete one. This is in line with the detection of water by JWST.
Our work highlights the importance of thermodynamic processes in shaping planetary interiors throughout their evolution. It is relevant for both solar system planets and exoplanets. If hydrogen-water demixing occurs in Uranus and Neptune, it should be accounted for in static models constrained by gravity data, as it can erode primordial water gradients and affect the calculated J2 by ~1000 ppm. Future work should also incorporate constraints from dynamo models (Stanley & Bloxham 2004, 2006), as done in Militzer (2024). Measurements of the atmospheric compositions of Uranus and Neptune would help constrain evolution models and possibly reconcile the observed heat-flux disparity between the two planets.
In the context of temperate and cold exoplanets, miscibility gaps - such as between hydrogen and water - must be considered. These processes can link the atmosphere to the deep interior, as material may be transported inward. With the remarkable quality of atmospheric data now available from instruments like JWST and the upcoming ARIEL mission, it is essential to better understand such interior processes in order to accurately interpret atmospheric spectra. This requires advances in planetary interiors and evolution models, as well as synergies with the high-pressure physics community, to refine phase diagrams and equations of state.
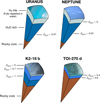 |
Fig. 7 Potential interior structures of Uranus, Neptune, K2-18b and TOI-270 d if they have undergone hydrogen-water demixing. We note that alternatives models are also possible (see Sects. 3 and 4). For Uranus and Neptune, the sketches correspond to the cases with Toffset = 1100 K, in which both planets are fully demixed. However, we can’t exclude scenarios in which demixing is still ongoing or does not occur at all. The sketch for K2-18 b shows a mini-Neptune scenario with ongoing demixing, while the one for TOI-270 d corresponds to a case of full demixing. |
Acknowledgements
We thank the referee for constructive comments which helped improve the manuscript. We acknowledge support from SNSF grant 200020_215634 and the National Centre for Competence in Research ‘PlanetS’ supported by SNSF. We thank S. Glenzer for fruitful discussions.
Appendix A Fit
We found that an equation based on a Lorentzian fits our data and the experimental data the best:
![Mathematical equation: T_{\rm demix}(P, x_{\rm H_2O}) &=a \times \left[\frac{1}{\pi}\frac{0.5(b+c \times P)}{(x-d)^2+(0.5 \times b)^2}\right] \times \notag \\ & (e \times P^3 + f \times P^2 + g \times P + h) + i \times P,](/articles/aa/full_html/2025/11/aa56322-25/aa56322-25-eq6.png) (A.1)
(A.1)
where xH2O is the number fraction of water. The parameters are given in Tab A.1.
Appendix B Water EOS comparison
The EOS of water remains one of the key sources of uncertainty in modeling the internal structure and evolution of water-rich planets. Despite significant progress through ab initio simulations, most existing EOS models for water are based on density functional theory molecular dynamics (DFT-MD) using the Perdew-Burke-Ernzerhof (PBE) exchange-correlation functional. However, it is well established that PBE tends to systematically underestimate binding energies and overestimate volumes, leading to inaccuracies in the calculated pressure and internal energy, particularly at high pressures and temperatures.
Moreover, current EOS tables often exhibit inconsistencies across different thermodynamic regimes. In particular, the interpolation between low-temperature data (e.g., from experimental measurements or empirical models) and high-temperature DFT-MD results is often poorly constrained. This is especially problematic when bridging the molecular-to-atomic transition or approaching the ideal gas regime, where DFT-MD becomes computationally expensive and alternative models are required. As a result, the thermodynamic consistency—ensuring continuous derivatives and matching of thermodynamic identities—is frequently violated. In addition, the influence of nuclear quantum effects (NQEs), particularly at low temperatures, is often neglected despite their potential impact on phase boundaries and heat capacities.
These uncertainties further justify the introduced shift in temperature Toffset. In an earlier work of Cano Amoros et al. (2024), such a shift was not necessary to produce demixing due to the use of a different water EOS (AQUA) that led to significantly colder adiabats. To compare our adiabats obtained with QEOS to those with AQUA, we calculated two Uranus adiabats with a constant heavy-element mass fraction throughout the envelope of either ZH2O = 0.4 or 0.8. These models assumed a core of 4 M⊕. Figure B.1 shows that temperature differences of up to ~ 1000 K at a few hundred kbar exist depending on the chosen water EOS. At pressures around a few kbar, the temperature differences are about 100-400 K.
Appendix C Energy considerations
Appendix C.1 Equation of conservation of energy
Two equivalent forms of the equation of conservation of energy are commonly used by planetary evolution codes:
 (C.1)
(C.1)
or,
 (C.2)
(C.2)
where L is the intrinsic luminosity, T is the temperature, S is the specific entropy, μi is the chemical potential of species i, Ni is the number of particles of species i, U is the specific internal energy, P is the pressure and ρ is the density. The second term of the right hand side part of Eq. C.1 accounts for changes in composition. It should be included whenever mixing or demixing processes occur. In the absence of particle exchanges, this term vanishes and Eq. C.1 simplifies accordingly. We refer the reader to Strittmatter et al. (1970) for a discussion about the correct forms of the energy conservation equation.
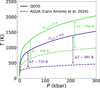 |
Fig. B.1 Comparison of Uranus adiabats calculated with different water EOSs. The dashed lines show adiabats from Cano Amoros et al. (2024), using AQUA. We calculated adiabats at similar conditions (T1bar = 72 K) using QEOS, shown with solid lines. Colors refer to different assumed water mass fractions in the planetary envelope. |
Throughout this work, we employed Eq. C.2 for all models, following Strittmatter et al. (1970). We here calculate one Uranus model (with Toffset = 600 K) using Eq. C.1 but without including the second term (Σi μi dNi) of the right hand side part. The comparison with the corresponding model from Sec. 3.1 based on Eq. C.2 is shown in Fig. C.1. We find that omitting this term influences the inferred radius by up to 2% only. Thus, while the Σi μidNi term is formally required in the general case of evolving compositions, for the Uranus models considered here its effect is small.
Appendix C.2 Energy deposition and heating in Uranus’ interior
In Fig. 2, we presented a Uranus model with Toffset = 1100 K, where the interior heats up at 3.5 Gyr. This temporary temperature increase can be understood by looking at the luminosity contribution dL/dm in each shell of our model (see Fig. C.2). Regions with dL/dm > 0 release energy outwards, while regions with dL/dm < 0 absorb energy. When dL/dm is negative, part of the gravitational energy is converted into internal (thermal) energy, which can lead to a temperature increase. The change of temperature can be estimated using ΔT = ΔU/(Mconv × cv), where ΔU is the added internal energy, Mconv the mass of the convective region, and cv the specific heat of the envelope. At 3 Gyr, a strong negative peak in dL/dm appears near a normalised mass of 0.85, associated with the redistribution of water after rainout. Integrating this peak over the corresponding mass range gives a luminosity contribution of about 3.6 × 10²² erg/s. For a timestep of 0.5 Gyr, this corresponds to an added internal energy Δ U = 6 × 1038 erg. Using Mconv = 10 M⊕ and cv = 2 × 10⁷ erg/g/K (Bailey & Stevenson 2021), we find ΔT = 480 K. In our model, the temperature at 10 bar increased by 100 K while the temperature rise in the deep interior is about 1000 K. Indeed, our simple estimate for the bulk temperature increase in the convective region is between these two values. This explains why the adiabat at 3.5 Gyr is shifted to higher temperatures. However, such a temperature increase is only temporary as convection subsequently transports the energy outward. The major positive dL/dm contribution in the outer 15% by mass at 3.5 Gyr leads to a significant energy release.
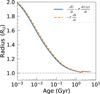 |
Fig. C.1 Comparison of the effect of the equation of conservation of energy on the inferred radius. We performed this comparison using one Uranus model (with Toffset = 600 K). |
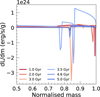 |
Fig. C.2 Radial distribution of luminosity contribution in Uranus’ evolution. We calculated dL/dm for the Uranus model with Toffset = 1100 K, which corresponds to the bottom row of Fig. 2. The grey dotted line shows dL/dm = 0. |
Appendix D Gravitational moments
Our Uranus models presented in Sec. 3.1 showed that hydrogenwater demixing can redistribute material through the planet evolution. This redistribution of material can change the internal density distribution and consequently affect the calculated gravitational moments. We calculated the gravitational moments (J2, J4) of our Uranus models using the Theory of Figures of order 7 implemented by Morf et al. (2024). The results are shown in Fig. D.1. In the case with Toffset = 600 K, where the outer 2% by mass are totally depleted in water, J2 changes by about 200 ppm and J4 by about 5 ppm. In the case with Toffset = 1100 K, where the outer 16% by mass are totally depleted in water, J2 changes by about 1000 ppm and J4 by about 10 ppm. This shows the importance of considering hydrogen-water immiscibility in interior models that try to match the gravity data.
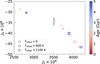 |
Fig. D.1 Gravitational moments of our Uranus models. The models correspond to the ones shown in Fig. 2. The black errorbar shows the observed values of J2 and J4 from French et al. (2024) which account for the wind corrections from Kaspi et al. (2013), as done in Cano Amoros et al. (2024). |
Appendix E Liquid water?
Figure E shows a water phase diagram with the adiabats of Uranus and K2-18b. Only the portions of the adiabats where water is present are plotted. For Uranus, we show the model with Toffset = 1100 K (see Sec. 3.1). For K2-18b, the model corresponds to the mini-Neptune scenario that considers hydrogenwater demixing (see Sec. 4.1). For both planets, our models do not suggest the presence of liquid water. The outer part of the envelope that only consists of hydrogen and helium, due to demixing, is too thick to allow the presence of water at low enough pressure and temperature. Further exploration of the parameter space would be needed to definitively rule out the potential presence of liquid water.
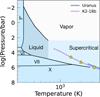 |
Fig. E.1 Water phase diagram. The curves for Uranus and K2-18 b show only the portions of the adiabats where water is present. The yellow circle shows the lower bound of the molecular phase from Redmer et al. (2011) while the triangle and square show the expected molecular-to-ionic and ionic-to-superionic transitions in K2-18b. |
Appendix F Non-adiabaticity
We calculated a Uranus model with Toffset = 600 K and with Rρ = 0.01 as defined in Sec. 5. Figure F.1 compares this model to the adiabatic case presented in Sec. 3.1. We do not find a significant impact of the superadiabatic gradient on the occurrence of demixing, nor on its effects on the planet’s radius or effective temperature evolution. However, this result depends on the assumed value of Rρ and on the characteristics of the water gradient. In the present model, the water gradient is located at pressures higher than those where phase separation occurs, which may limit its influence on the demixing process.
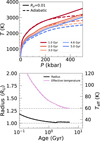 |
Fig. F.1 Evolution of Uranus comparing adiabatic and super-adiabatic interiors. Top panel. temperature-pressure profiles. Bottom panel. radius and effective temperature as a function of age. The horizontal dashed lines show the measured values. |
References
- Aguichine, A., Batalha, N., Fortney, J. J., et al. 2024, arXiv e-prints [arXiv:2412.17945] [Google Scholar]
- Arevalo, R. T. 2025, Different Inhomogeneous Evolutionary Histories for Uranus and Neptune [arXiv:2506.13857] [Google Scholar]
- Asplund, M., Amarsi, A. M., & Grevesse, N. 2021, A&A, 653, A141 [NASA ADS] [CrossRef] [EDP Sciences] [Google Scholar]
- Bailey, E., & Stevenson, D. J. 2021, Planet. Sci. J., 2, 64 [NASA ADS] [CrossRef] [Google Scholar]
- Bali, E., Audétat, A., & Keppler, H. 2013, Nature, 495, 220 [CrossRef] [Google Scholar]
- Benneke, B., Wong, I., Piaulet, C., et al. 2019, ApJ, 887, L14 [Google Scholar]
- Benneke, B., Roy, P.-A., Coulombe, L.-P., et al. 2024, arXiv e-prints [arXiv:2403.03325] [Google Scholar]
- Bergermann, A., French, M., & Redmer, R. 2021a, Phys. Chem. Chem. Phys., 23, 12637 [Google Scholar]
- Bergermann, A., French, M., Schöttler, M., & Redmer, R. 2021b, Phys. Rev. E, 103, 013307 [Google Scholar]
- Bergermann, A., French, M., & Redmer, R. 2024, Phys. Rev. B, 109, 174107 [NASA ADS] [CrossRef] [Google Scholar]
- Bodenheimer, P., Stevenson, D. J., Lissauer, J. J., & D’Angelo, G. 2025, arXiv e-prints [arXiv:2504.17227] [Google Scholar]
- Brygoo, S., Loubeyre, P., Millot, M., et al. 2021, Nature, 593, 517 [NASA ADS] [CrossRef] [Google Scholar]
- Cano Amoros, M., Nettelmann, N., Tosi, N., Baumeister, P., & Rauer, H. 2024, A&A, 692, A152 [NASA ADS] [CrossRef] [EDP Sciences] [Google Scholar]
- Chabrier, G., Mazevet, S., & Soubiran, F. 2019, ApJ, 872, 51 [NASA ADS] [CrossRef] [Google Scholar]
- Charnay, B., Blain, D., Bézard, B., et al. 2021, A&A, 646, A171 [NASA ADS] [CrossRef] [EDP Sciences] [Google Scholar]
- Cheng, B., Hamel, S., & Bethkenhagen, M. 2023, Nat. Commun., 14, 1104 [Google Scholar]
- Cloutier, R., Astudillo-Defru, N., Doyon, R., et al. 2019, A&A, 621, A49 [NASA ADS] [CrossRef] [EDP Sciences] [Google Scholar]
- Fortney, J. J., Ikoma, M., Nettelmann, N., Guillot, T., & Marley, M. S. 2011, ApJ, 729, 32 [NASA ADS] [CrossRef] [Google Scholar]
- French, R. G., Hedman, M. M., Nicholson, P. D., Longaretti, P.-Y., & McGhee-French, C. A. 2024, Icarus, 411, 115957 [CrossRef] [Google Scholar]
- Guillot, T. 1995, Science, 269, 1697 [CrossRef] [Google Scholar]
- Guillot, T. 2010, A&A, 520, A27 [NASA ADS] [CrossRef] [EDP Sciences] [Google Scholar]
- Guillot, T., & Morel, P. 1995, A&AS, 109, 109 [NASA ADS] [Google Scholar]
- Gupta, A., Stixrude, L., & Schlichting, H. E. 2025, ApJ, 982, L35 [Google Scholar]
- He, Z., Rödel, M., Lütgert, J., et al. 2022, Sci. Adv., 8, eabo0617 [Google Scholar]
- Helled, R., & Howard, S. 2024, arXiv e-prints [arXiv:2407.05853] [Google Scholar]
- Howard, S., & Guillot, T. 2023, A&A, 672, L1 [NASA ADS] [CrossRef] [EDP Sciences] [Google Scholar]
- Howard, S., Guillot, T., Bazot, M., et al. 2023, A&A, 672, A33 [NASA ADS] [CrossRef] [EDP Sciences] [Google Scholar]
- Howard, S., Müller, S., & Helled, R. 2024, A&A, 689, A15 [NASA ADS] [CrossRef] [EDP Sciences] [Google Scholar]
- Howard, S., Helled, R., & Müller, S. 2025, A&A, 693, L7 [NASA ADS] [CrossRef] [EDP Sciences] [Google Scholar]
- Hubbard, W. B., & Marley, M. S. 1989, Icarus, 78, 102 [Google Scholar]
- Irwin, P. G. J., Wenkert, D. D., Simon, A. A., Dahl, E., & Hammel, H. B. 2025, MNRAS, 540, 1719 [Google Scholar]
- Jin, S., Mordasini, C., Parmentier, V., et al. 2014, ApJ, 795, 65 [Google Scholar]
- Kaspi, Y., Showman, A. P., Hubbard, W. B., Aharonson, O., & Helled, R. 2013, Nature, 497, 344 [NASA ADS] [CrossRef] [Google Scholar]
- Knierim, H., & Helled, R. 2024, arXiv e-prints [arXiv:2407.09341] [Google Scholar]
- Leconte, J., Selsis, F., Hersant, F., & Guillot, T. 2017, A&A, 598, A98 [NASA ADS] [CrossRef] [EDP Sciences] [Google Scholar]
- Lin, Z., Seager, S., & Weiss, B. P. 2025, Planet. Sci. J., 6, 27 [Google Scholar]
- Lorenzen, W., Holst, B., & Redmer, R. 2009, Phys. Rev. Lett., 102, 115701 [NASA ADS] [CrossRef] [Google Scholar]
- Lorenzen, W., Holst, B., & Redmer, R. 2011, Phys. Rev. B, 84, 235109 [NASA ADS] [CrossRef] [Google Scholar]
- Luque, R., Piaulet-Ghorayeb, C., Radica, M., et al. 2025, A&A, 700, A284 [NASA ADS] [CrossRef] [EDP Sciences] [Google Scholar]
- Madhusudhan, N., Nixon, M. C., Welbanks, L., Piette, A. A. A., & Booth, R. A. 2020, ApJ, 891, L7 [Google Scholar]
- Madhusudhan, N., Sarkar, S., Constantinou, S., et al. 2023, ApJ, 956, L13 [NASA ADS] [CrossRef] [Google Scholar]
- Madhusudhan, N., Constantinou, S., Holmberg, M., et al. 2025, ApJ, 983, L40 [Google Scholar]
- Mankovich, C. R., & Fortney, J. J. 2020, ApJ, 889, 51 [NASA ADS] [CrossRef] [Google Scholar]
- Mankovich, C., Fortney, J. J., & Moore, K. L. 2016, ApJ, 832, 113 [NASA ADS] [CrossRef] [Google Scholar]
- Markham, S., & Stevenson, D. 2021, Planet. Sci. J., 2, 146 [NASA ADS] [CrossRef] [Google Scholar]
- Mazevet, S., Licari, A., Chabrier, G., & Potekhin, A. Y. 2019, A&A, 621, A128 [NASA ADS] [CrossRef] [EDP Sciences] [Google Scholar]
- Militzer, B. 2024, Proc. Natl. Acad. Sci., 121, e2403981121 [Google Scholar]
- Morales, M. A., Hamel, S., Caspersen, K., & Schwegler, E. 2013, Phys. Rev. B, 87, 174105 [NASA ADS] [CrossRef] [Google Scholar]
- More, R. M., Warren, K. H., Young, D. A., & Zimmerman, G. B. 1988, Phys. Fluids, 31, 3059 [NASA ADS] [CrossRef] [Google Scholar]
- Morel, P. 1997, A&AS, 124, 597 [NASA ADS] [CrossRef] [EDP Sciences] [Google Scholar]
- Morf, L., Müller, S., & Helled, R. 2024, A&A, 690, A105 [NASA ADS] [CrossRef] [EDP Sciences] [Google Scholar]
- Müller, S., & Helled, R. 2023, A&A, 669, A24 [NASA ADS] [CrossRef] [EDP Sciences] [Google Scholar]
- Müller, S., Helled, R., & Cumming, A. 2020, A&A, 638, A121 [Google Scholar]
- Nettelmann, N., Helled, R., Fortney, J. J., & Redmer, R. 2013, Planet. Space Sci., 77, 143 [Google Scholar]
- Nettelmann, N., Fortney, J. J., Moore, K., & Mankovich, C. 2015, MNRAS, 447, 3422 [NASA ADS] [CrossRef] [Google Scholar]
- Nettelmann, N., Wang, K., Fortney, J. J., et al. 2016, Icarus, 275, 107 [Google Scholar]
- Neuenschwander, B. A., & Helled, R. 2022, MNRAS, 512, 3124 [CrossRef] [Google Scholar]
- Neuenschwander, B. A., Müller, S., & Helled, R. 2024, A&A, 684, A191 [NASA ADS] [CrossRef] [EDP Sciences] [Google Scholar]
- Ormel, C. W., Vazan, A., & Brouwers, M. G. 2021, A&A, 647, A175 [NASA ADS] [CrossRef] [EDP Sciences] [Google Scholar]
- Pica-Ciamarra, L., Madhusudhan, N., Cooke, G. J., Constantinou, S., & Binet, M. 2025, arXiv e-prints [arXiv:2505.10539] [Google Scholar]
- Redmer, R., Mattsson, T. R., Nettelmann, N., & French, M. 2011, Icarus, 211, 798 [CrossRef] [Google Scholar]
- Salpeter, E. E. 1973, ApJ, 181, L83 [Google Scholar]
- Scheibe, L., Nettelmann, N., & Redmer, R. 2019, A&A, 632, A70 [NASA ADS] [CrossRef] [EDP Sciences] [Google Scholar]
- Scheibe, L., Nettelmann, N., & Redmer, R. 2021, A&A, 650, A200 [NASA ADS] [CrossRef] [EDP Sciences] [Google Scholar]
- Schmidt, S. P., MacDonald, R. J., Tsai, S.-M., et al. 2025, arXiv e-prints [arXiv:2501.18477] [Google Scholar]
- Schöttler, M., & Redmer, R. 2018a, Phys. Rev. Lett., 120, 115703 [CrossRef] [Google Scholar]
- Schöttler, M., & Redmer, R. 2018b, J. Plasma Phys., 84, 755840401 [CrossRef] [Google Scholar]
- Seward, T. M., & Franck, E. U. 1981, Berichte der Bunsengesellschaft für physikalische Chemie, 85, 2 [Google Scholar]
- Shorttle, O., Jordan, S., Nicholls, H., Lichtenberg, T., & Bower, D. J. 2024, ApJ, 962, L8 [NASA ADS] [CrossRef] [Google Scholar]
- Smoluchowski, R. 1967, Nature, 215, 691 [NASA ADS] [CrossRef] [Google Scholar]
- Stanley, S., & Bloxham, J. 2004, Nature, 428, 151 [CrossRef] [Google Scholar]
- Stanley, S., & Bloxham, J. 2006, Icarus, 184, 556 [NASA ADS] [CrossRef] [Google Scholar]
- Stevenson, D. J., & Salpeter, E. E. 1977, ApJS, 35, 239 [NASA ADS] [CrossRef] [Google Scholar]
- Strittmatter, P. A., Faulkner, J., Robertson, J. W., & Faulkner, D. J. 1970, ApJ, 161, 369 [Google Scholar]
- Taylor, J. 2025, arXiv e-prints [arXiv:2504.15916] [Google Scholar]
- Valencia, D., Guillot, T., Parmentier, V., & Freedman, R. S. 2013, ApJ, 775, 10 [NASA ADS] [CrossRef] [Google Scholar]
- Valletta, C., & Helled, R. 2020, ApJ, 900, 133 [NASA ADS] [CrossRef] [Google Scholar]
- Valletta, C., & Helled, R. 2022, ApJ, 931, 21 [NASA ADS] [CrossRef] [Google Scholar]
- Van Eylen, V., Astudillo-Defru, N., Bonfils, X., et al. 2021, MNRAS, 507, 2154 [NASA ADS] [Google Scholar]
- Vazan, A., & Helled, R. 2020, A&A, 633, A50 [NASA ADS] [CrossRef] [EDP Sciences] [Google Scholar]
- Vazan, A., & Ormel, C. W. 2023, A&A, 676, L8 [NASA ADS] [CrossRef] [EDP Sciences] [Google Scholar]
- Vazan, A., Helled, R., & Guillot, T. 2018, A&A, 610, L14 [NASA ADS] [CrossRef] [EDP Sciences] [Google Scholar]
- Vazan, A., Sari, R., & Kessel, R. 2022, ApJ, 926, 150 [NASA ADS] [CrossRef] [Google Scholar]
- Vazan, A., Ormel, C. W., & Brouwers, M. G. 2024, A&A, 687, A262 [NASA ADS] [CrossRef] [EDP Sciences] [Google Scholar]
- Vlasov, K., Audétat, A., & Keppler, H. 2023, Contrib. Mineral. Petrol., 178, 36 [NASA ADS] [CrossRef] [Google Scholar]
- Wang, X., Li, L., Roman, M., et al. 2025, arXiv e-prints [arXiv:2502.20722] [Google Scholar]
- Welbanks, L., Nixon, M. C., McGill, P., et al. 2025, arXiv e-prints [arXiv:2504.21788] [Google Scholar]
- Wogan, N. F., Batalha, N. E., Zahnle, K. J., et al. 2024, ApJ, 963, L7 [NASA ADS] [CrossRef] [Google Scholar]
Note that, as mentioned in Aguichine et al. (2024), there is a problem with the entropy in AQUA due to an error in the code of Mazevet et al. (2019).
All Tables
All Figures
|
Fig. 1 Miscibility gap of hydrogen and water for different temperatures (color-coded). DFT-MD simulations by (Bergermann et al. 2024) are shown as colored circles while earlier experimental campaigns of Seward & Franck (1981), Bali et al. (2013), and Vlasov et al. (2023) are presented by colored diamonds and traingles, respectively. |
| In the text | |
|
Fig. 2 Evolution models of Uranus. Each row shows results for a different temperature offset applied to the hydrogen-water phase diagram (Toffset = 0, 600 or 1000 K.) Left panels : temperature-pressure profiles at different ages. Phase curves are shown with grey to black lines for water mass fractions of 0.92 to 0. Grey-shaded areas mark demixing regions. Center panels : water mass fraction as a function of normalized mass, colored by age. Right panels : radius and effective temperature as a function of age. The horizontal dashed lines show the measured values. |
| In the text | |
|
Fig. 3 Evolution models of Neptune. Description is same as for Fig. 2. For comparison, Uranus models are shown with dashed lines. |
| In the text | |
|
Fig. 4 Evolution models of K2-18b. Top panel : planetary radius as a function of age. The black errorbar corresponds to the measured radius and age. Bottom panel : heavy-element mass fraction at 2.4 Gyr (the planet’s age) as a function of pressure. We note that condensation was not considered in our models, which explains why some models have a high heavy-element mass fraction at low pressures. |
| In the text | |
|
Fig. 5 Evolution models of TOI-270d. Top panel : planetary radius as a function of age. The black errorbar corresponds to the measured radius and age. Since the age is uncertain, we adopted an age range of 1 to 10 Gyr. Bottom panel: heavy-element mass fraction at the end of the evolution as a function of pressure. The orange and blue shaded areas show the observed atmospheric metal and water mass fractions, respectively (from Benneke et al. 2024). |
| In the text | |
|
Fig. 6 Temperature-pressure profiles of the envelopes of K2-18b and TOI-270 d. A range of profiles between 500 Myr and 2.4 Gyr is shown for K2-18 b while a range between 1 and 10 Gyr is shown for TOI-270 d. Phase curves for different water mass fractions are shown with grey to black lines. |
| In the text | |
|
Fig. 7 Potential interior structures of Uranus, Neptune, K2-18b and TOI-270 d if they have undergone hydrogen-water demixing. We note that alternatives models are also possible (see Sects. 3 and 4). For Uranus and Neptune, the sketches correspond to the cases with Toffset = 1100 K, in which both planets are fully demixed. However, we can’t exclude scenarios in which demixing is still ongoing or does not occur at all. The sketch for K2-18 b shows a mini-Neptune scenario with ongoing demixing, while the one for TOI-270 d corresponds to a case of full demixing. |
| In the text | |
|
Fig. B.1 Comparison of Uranus adiabats calculated with different water EOSs. The dashed lines show adiabats from Cano Amoros et al. (2024), using AQUA. We calculated adiabats at similar conditions (T1bar = 72 K) using QEOS, shown with solid lines. Colors refer to different assumed water mass fractions in the planetary envelope. |
| In the text | |
|
Fig. C.1 Comparison of the effect of the equation of conservation of energy on the inferred radius. We performed this comparison using one Uranus model (with Toffset = 600 K). |
| In the text | |
|
Fig. C.2 Radial distribution of luminosity contribution in Uranus’ evolution. We calculated dL/dm for the Uranus model with Toffset = 1100 K, which corresponds to the bottom row of Fig. 2. The grey dotted line shows dL/dm = 0. |
| In the text | |
|
Fig. D.1 Gravitational moments of our Uranus models. The models correspond to the ones shown in Fig. 2. The black errorbar shows the observed values of J2 and J4 from French et al. (2024) which account for the wind corrections from Kaspi et al. (2013), as done in Cano Amoros et al. (2024). |
| In the text | |
|
Fig. E.1 Water phase diagram. The curves for Uranus and K2-18 b show only the portions of the adiabats where water is present. The yellow circle shows the lower bound of the molecular phase from Redmer et al. (2011) while the triangle and square show the expected molecular-to-ionic and ionic-to-superionic transitions in K2-18b. |
| In the text | |
|
Fig. F.1 Evolution of Uranus comparing adiabatic and super-adiabatic interiors. Top panel. temperature-pressure profiles. Bottom panel. radius and effective temperature as a function of age. The horizontal dashed lines show the measured values. |
| In the text | |
Current usage metrics show cumulative count of Article Views (full-text article views including HTML views, PDF and ePub downloads, according to the available data) and Abstracts Views on Vision4Press platform.
Data correspond to usage on the plateform after 2015. The current usage metrics is available 48-96 hours after online publication and is updated daily on week days.
Initial download of the metrics may take a while.