Fig. 2
Download original image
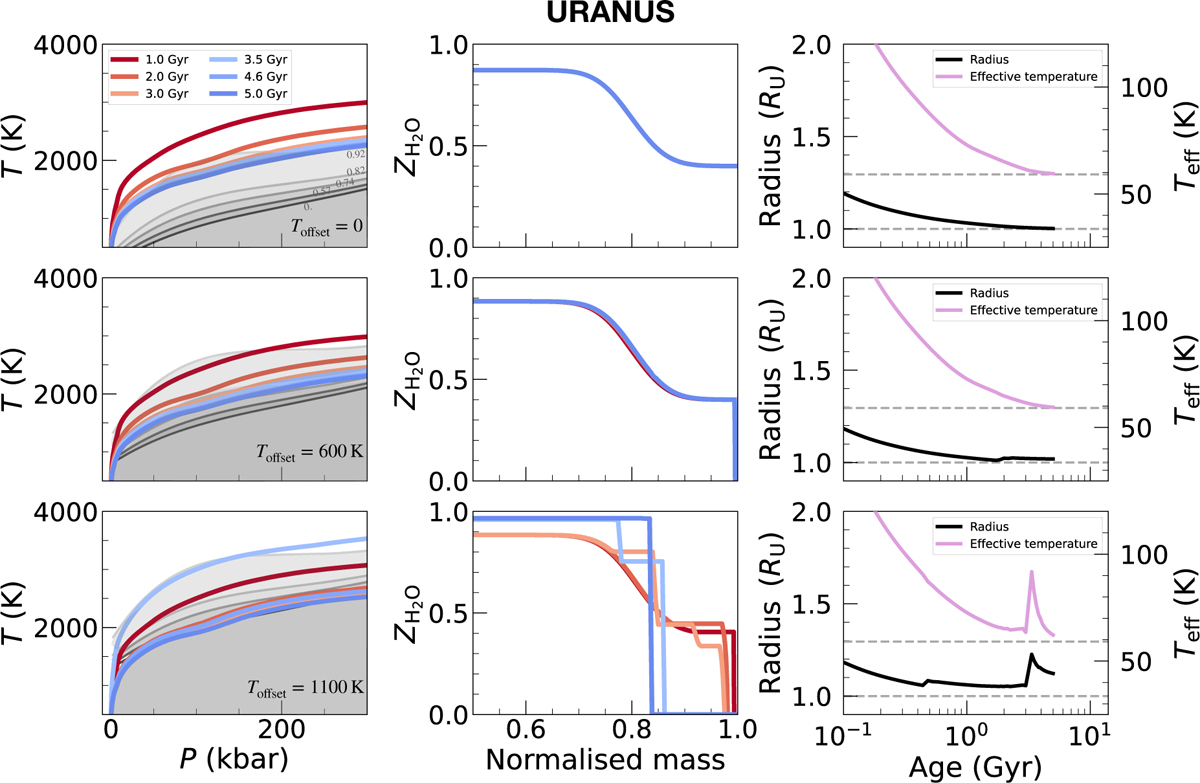
Evolution models of Uranus. Each row shows results for a different temperature offset applied to the hydrogen-water phase diagram (Toffset = 0, 600 or 1000 K.) Left panels : temperature-pressure profiles at different ages. Phase curves are shown with grey to black lines for water mass fractions of 0.92 to 0. Grey-shaded areas mark demixing regions. Center panels : water mass fraction as a function of normalized mass, colored by age. Right panels : radius and effective temperature as a function of age. The horizontal dashed lines show the measured values.
Current usage metrics show cumulative count of Article Views (full-text article views including HTML views, PDF and ePub downloads, according to the available data) and Abstracts Views on Vision4Press platform.
Data correspond to usage on the plateform after 2015. The current usage metrics is available 48-96 hours after online publication and is updated daily on week days.
Initial download of the metrics may take a while.