Open Access
Fig. 6
Download original image
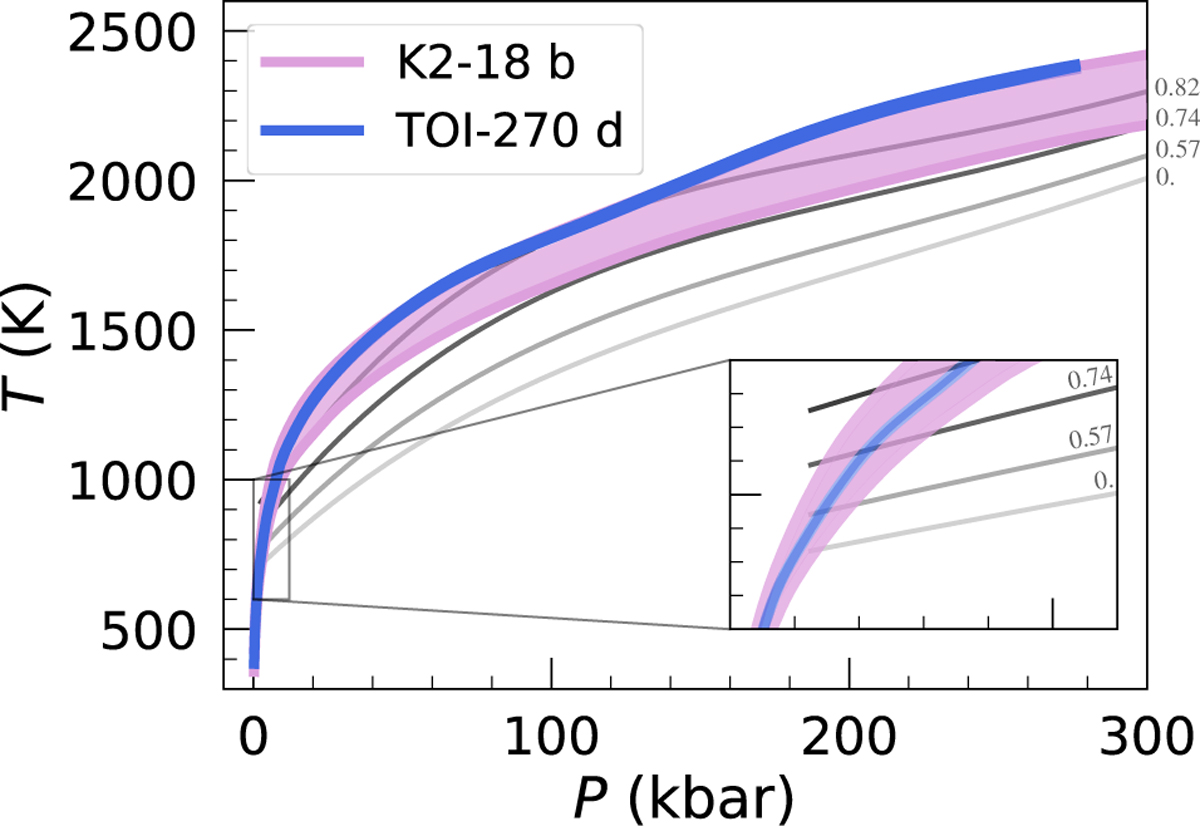
Temperature-pressure profiles of the envelopes of K2-18b and TOI-270 d. A range of profiles between 500 Myr and 2.4 Gyr is shown for K2-18 b while a range between 1 and 10 Gyr is shown for TOI-270 d. Phase curves for different water mass fractions are shown with grey to black lines.
Current usage metrics show cumulative count of Article Views (full-text article views including HTML views, PDF and ePub downloads, according to the available data) and Abstracts Views on Vision4Press platform.
Data correspond to usage on the plateform after 2015. The current usage metrics is available 48-96 hours after online publication and is updated daily on week days.
Initial download of the metrics may take a while.