Fig. 1
Download original image
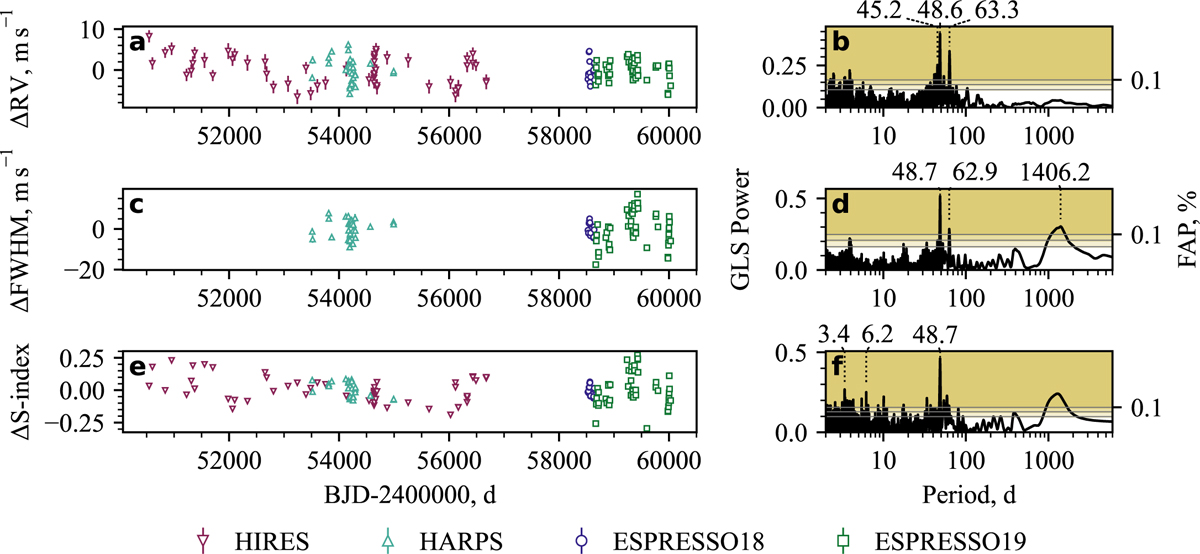
Time series of mean-subtracted (a) RV, (c) FWHM, (e) S-index. The measurements are marked according to the data source: pink downward triangles for HIRES, teal upward triangles for HARPS, blue circles for ESPRESSO18, and green squares for ESPRESSO19. (b,d,f) Associated wide-period GLSPs of RV and activity indicators. Three FAP levels: 10%, 1%, and 0.1%, split GLSP ordinates in bands of different colours. We highlight the three most prominent peaks in each GLSP.
Current usage metrics show cumulative count of Article Views (full-text article views including HTML views, PDF and ePub downloads, according to the available data) and Abstracts Views on Vision4Press platform.
Data correspond to usage on the plateform after 2015. The current usage metrics is available 48-96 hours after online publication and is updated daily on week days.
Initial download of the metrics may take a while.