Fig. B.2
Download original image
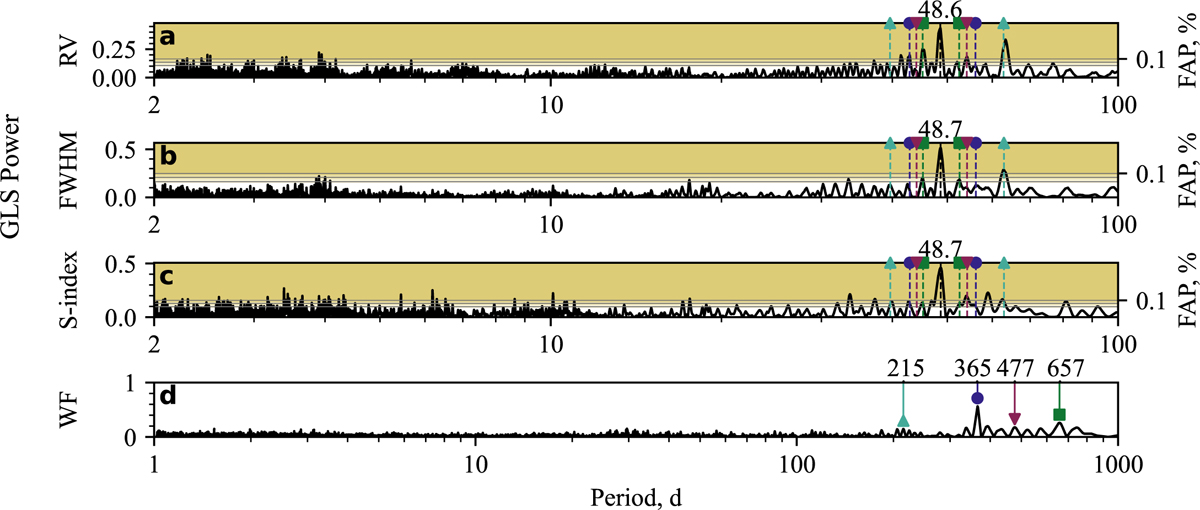
Alias analysis of raw time series: (a) RV, (b) FWHM, (c) S-index. We focus on the aliases of the 48.6 d signal. (d) The window function reveals four prominent peaks at 215 d (upward teal triangle), 365 d (blue circle), 475 d (downward red triangle), and 635 d (green square). The relevant aliases in data periodograms are plotted with dashed lines of a corresponding colour and marker.
Current usage metrics show cumulative count of Article Views (full-text article views including HTML views, PDF and ePub downloads, according to the available data) and Abstracts Views on Vision4Press platform.
Data correspond to usage on the plateform after 2015. The current usage metrics is available 48-96 hours after online publication and is updated daily on week days.
Initial download of the metrics may take a while.