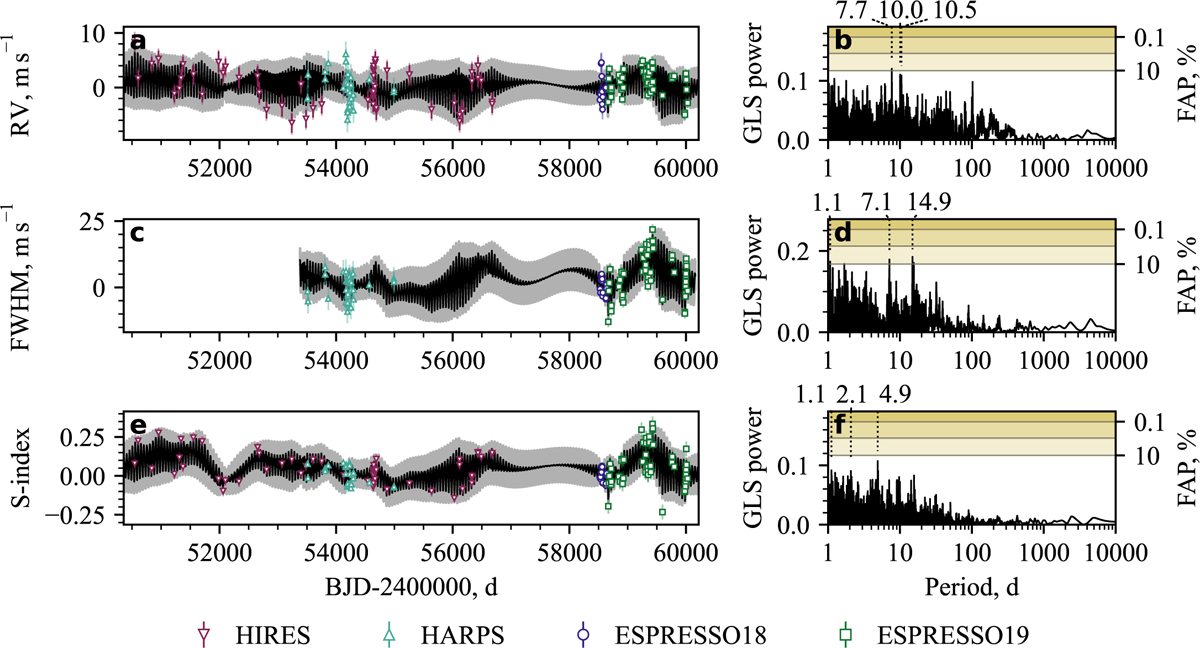
Fig. B.3
Download original image
Raw time series (markers) against our best model (black; LTF+GP), over the whole dataset baseline in (a) RV, (c) FWHM, (e) S-index. The data points come with two error bars: one assigned by the instrument (saturated) and another that includes the model jitter (semi-transparent). (b,d,f) Associated GLSPs of the residual time series of our best model, accounting for the model jitter.
Current usage metrics show cumulative count of Article Views (full-text article views including HTML views, PDF and ePub downloads, according to the available data) and Abstracts Views on Vision4Press platform.
Data correspond to usage on the plateform after 2015. The current usage metrics is available 48-96 hours after online publication and is updated daily on week days.
Initial download of the metrics may take a while.