Fig. 4
Download original image
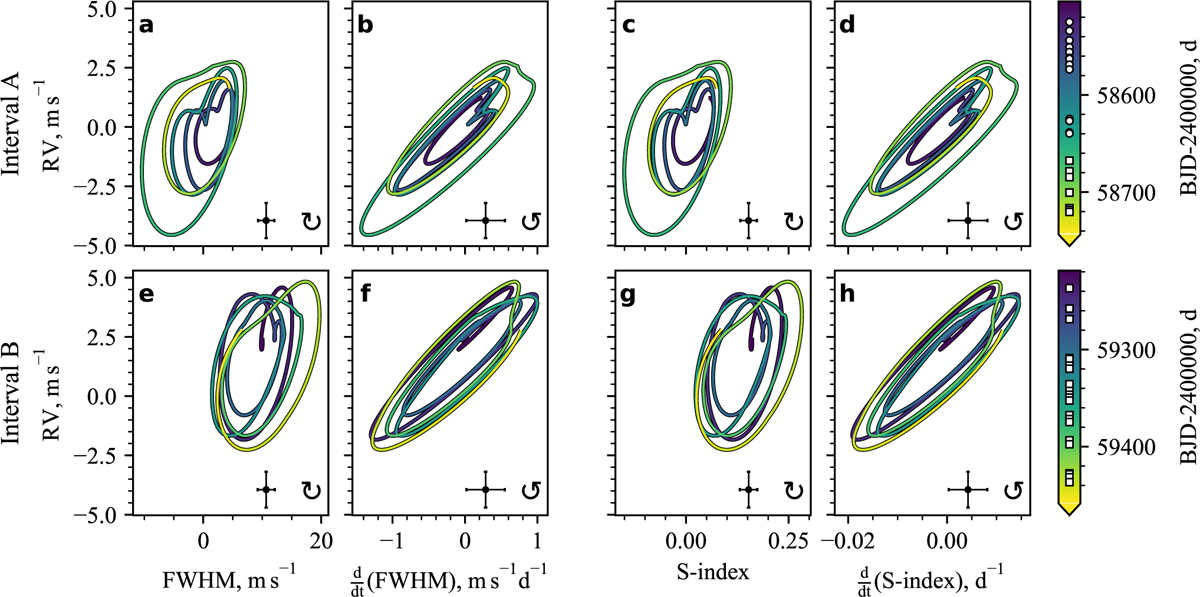
Phase-space trajectories built from our best-model predictions in Fig. 3, in the same selected intervals. We compare RV with (a, b) FWHM, (c, d) the time derivative of FWHM, (e, f) S-index, and (g, h) the time derivative of S-index. Time runs from blue to yellow, as defined by the colour bars on the right-hand side. The same colour bars contain the temporal location of ESPRESSO18 (circles) and ESPRESSO19 (squares) measurements. Every trajectory comes with a mark at the bottom right that guides the direction of evolution, as well as the median model uncertainty in each dimension.
Current usage metrics show cumulative count of Article Views (full-text article views including HTML views, PDF and ePub downloads, according to the available data) and Abstracts Views on Vision4Press platform.
Data correspond to usage on the plateform after 2015. The current usage metrics is available 48-96 hours after online publication and is updated daily on week days.
Initial download of the metrics may take a while.