Fig. 2.
Download original image
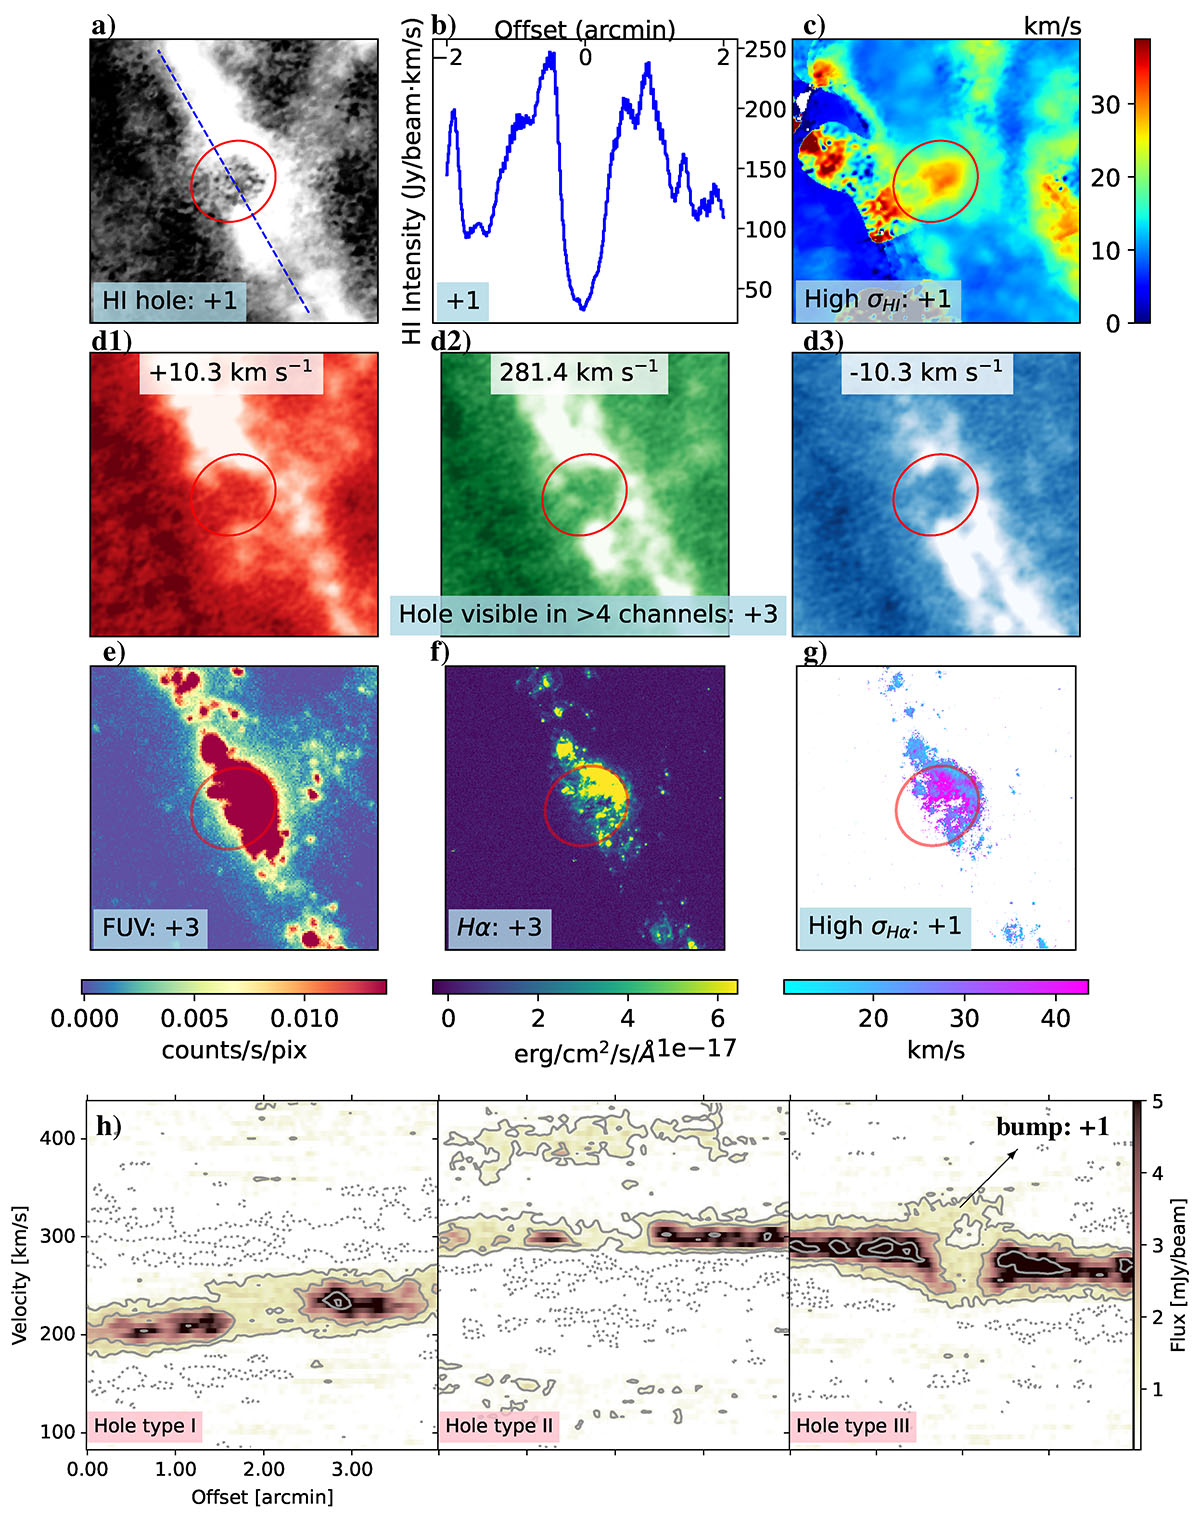
Example of our multi-wavelength quality assurance scoring for candidate H I holes. Panels a–g: Each panel corresponds to the same hole (Hole 1) with the red ellipse marking its boundary and annotations in light blue giving the score for each feature. (a) H I moment-0 map showing a cavity. (b) H I line profile along the blue dashed line in panel a, used to quantify a 50% surface brightness depression. (c) H I velocity-dispersion (moment-2) map highlighting locally elevated σHI. (d1–d3) Individual H I channel map at representative velocities; the hole is visible in > 4 consecutive channels. (e) GALEX FUV map with bright emission coincident with the hole. (f) Hα emission map with strong flux within the hole. (g) Hα velocity-dispersion map with elevated σHα inside the hole. Bottom row: Position–velocity (PV) diagrams illustrating the three morphological classes of holes following Brinks & Bajaja (1986). The PV panels here (left to right) show Hole 3 (Type I), Hole 2 (Type II), and Hole 1 (Type III). Hole 2 also suffers from a tidal interaction, see Section 4.
Current usage metrics show cumulative count of Article Views (full-text article views including HTML views, PDF and ePub downloads, according to the available data) and Abstracts Views on Vision4Press platform.
Data correspond to usage on the plateform after 2015. The current usage metrics is available 48-96 hours after online publication and is updated daily on week days.
Initial download of the metrics may take a while.